
Global Macro Weekly Playbook (6 Feb)
The “risk-on” narrative may have reached a tipping point

Greetings folks! Welcome to the latest edition of the “Global Macro Weekly Playbook” newsletter where we will be taking a deep dive into the common narratives to uncover macro mispricing and how it impacts the broad-based asset classes from a tactical perspective.
Recap for last week…
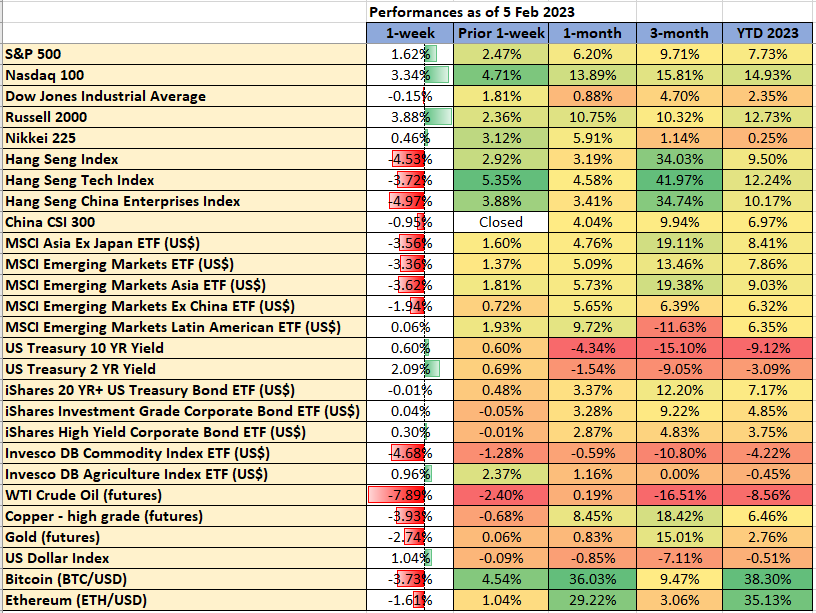
Data from TradingView & MarketWatch
The “risk-on” narrative in place since late October last year has started to show signs of fatigue post-Fed’s FOMC and January’s US non-farm payrolls data where the US economy created 517K jobs in the first month of 2023, way above consensus estimates of +185K, the highest since July 2022 and above an average monthly gain of 401K in 2022.
The underperformers were the China, Asia, and emerging markets equities where their respective benchmark stock indices recorded losses between 5% to 1% for last week and triggered a negative feedback loop into commodities prices where the WTI crude oil futures recorded a weekly loss of 7.89%, its worst performance in the past four weeks.
Weakness can also be seen in Gold (an increase in opportunity cost) via the expected weekly uptick in the US 10-year Treasury yield that included a daily gain of 13 bps recorded last Friday, 3 February, the highest single-day rally since 19 October 2022.
Also, the up move in the US 10-year Treasury yield has managed to slow down the US dollar’s downside momentum as the USD Dollar Index recorded a weekly gain of 1.05%, the most since the week of 19 September 2022.
Key economic data & events to watch for this week
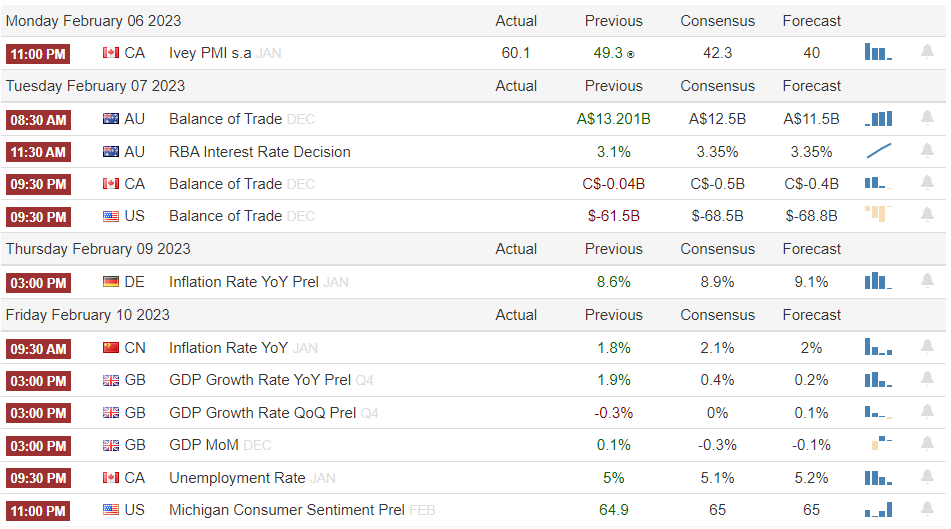
Source: Trading Economics (SG timing)
US Q4 2022 earnings season: leading firms to watch for this week will be Activision Blizzard, Uber, Walt Disney PayPal, PepsiCo, and Philip Morris International. A full table of notable reporting firms is as follows;
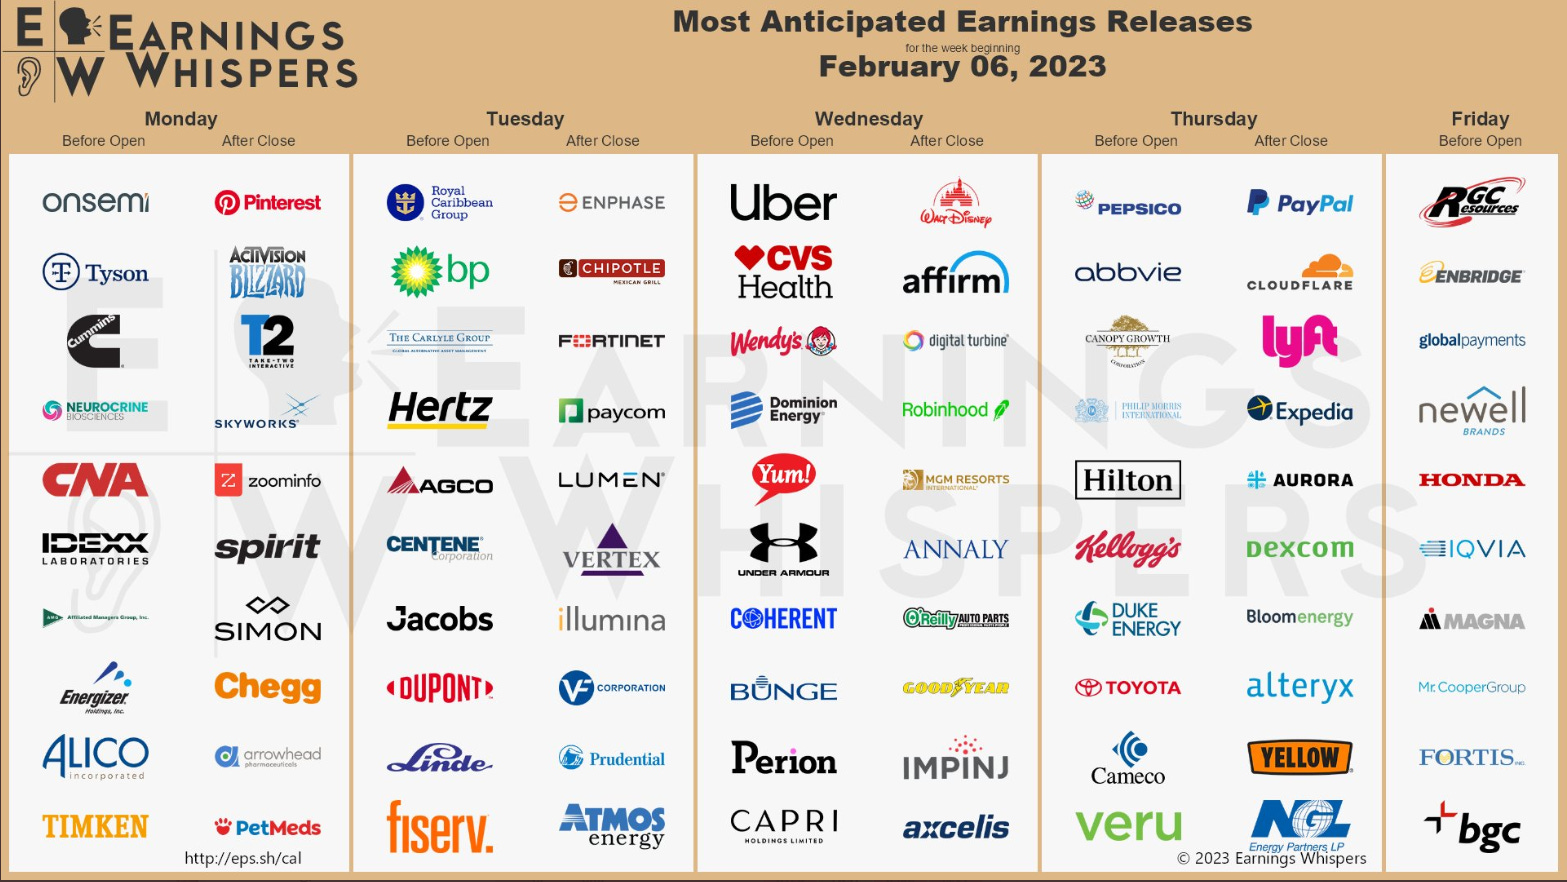
Source: Earnings Whispers
Going forward...
I have highlighted earlier in my previous editions of the “Global Macro Weekly Playbook” that the risk-on rally seen in the markets since late Q4 2022 is akin to “building castles of hopes” due to “Janus-faced” effect that has taken hold on market participants’ perceptions in general.
Right now, some form of reality has started to set in after last Friday’s red-hot US non-farm payrolls/jobs data and the Intermarket relationships at play that have triggered a negative feedback loop in Gold and US Treasuries via a spiked up in Treasuries yields and the US dollar. Hence, the chatter of a “Fed Pivot” and “Rate Cut” is likely to take a backseat in the short to medium term.
Watch out for short to medium-term USD strength revival
Key bullish signals were spotted earlier in the US 10-year Treasury yield in the prior two weeks that I mentioned to keep a close watch on it in previous editions of the newsletter before triggering a significant spike up last Friday, 3 February (click here for a recap).
The up move in the US 10-year Treasury yield has managed to provide the support to halt the four-month decline of the US Dollar Index in place since its 28 September 2022 high of 114.78.
Using Intermarket and integrated technical analysis (graphical, momentum & Elliot Wave/fractals, the US Dollar Index is likely to have ended the first leg of the medium-term downtrend phase on 2 February 2023 low of 100.82. Right now, it is undergoing a potential corrective rebound to retrace the prior 4-month medium-term downtrend phase for a retest on the 106.10/107.77 resistance zone (also the 200-day moving average).
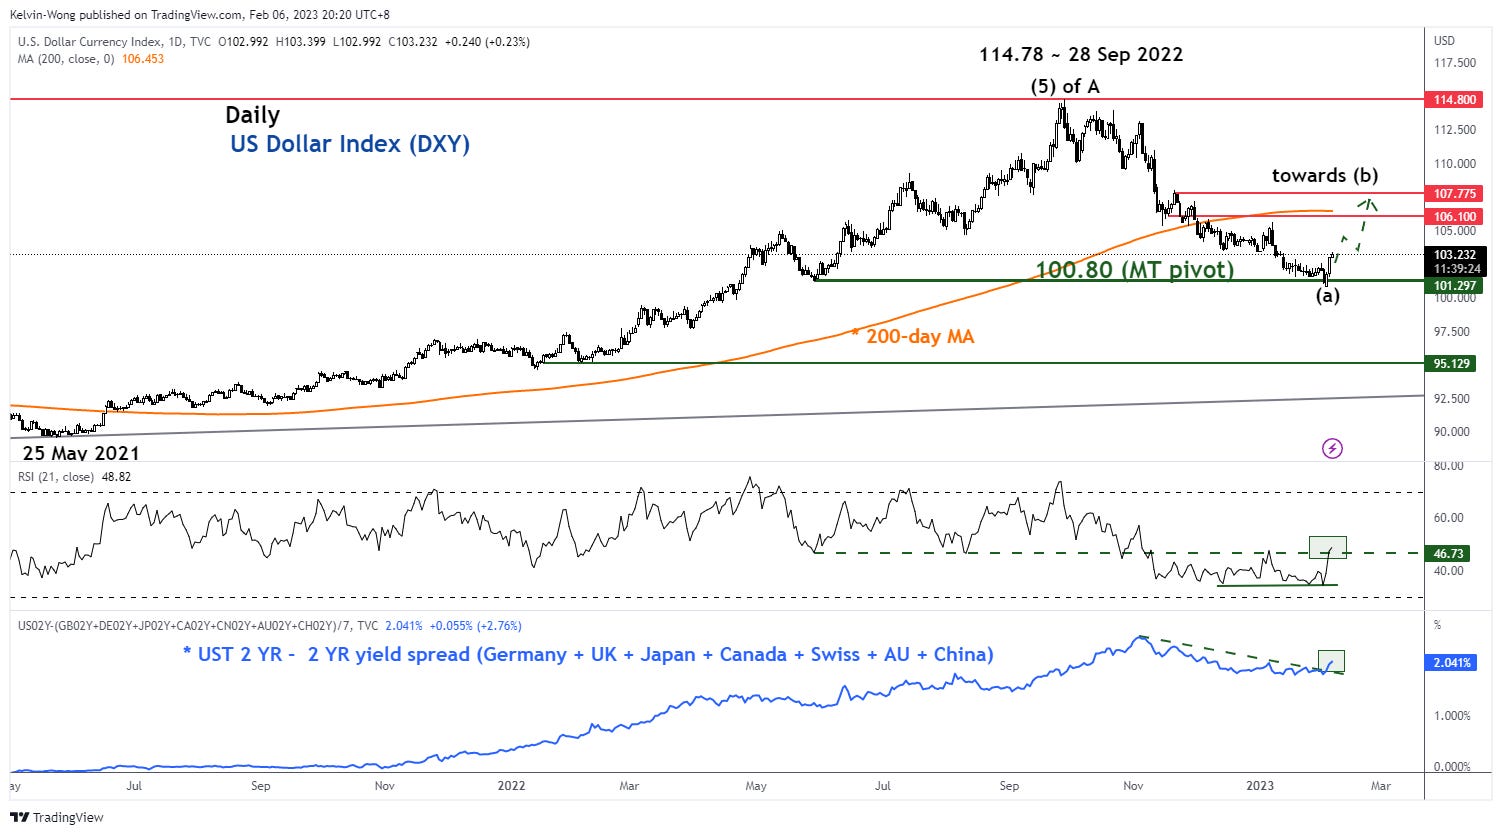
Source: TradingView as of 6 Feb 2023
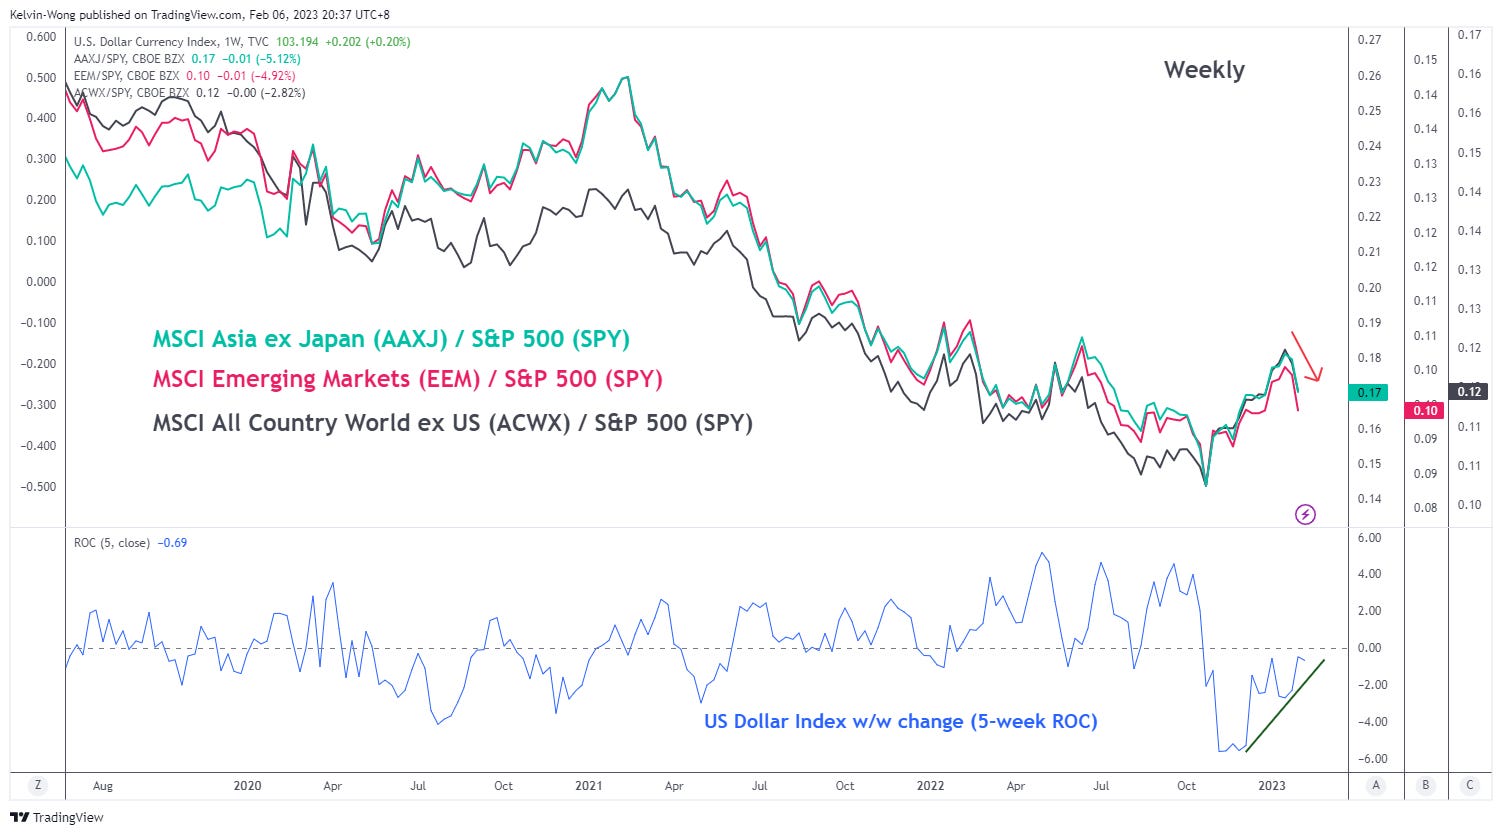
Emerging markets & Asia ex Japan equities outperformance against S&P 500 may face headwinds
Source: TradingView as of 6 Feb 2023
The outperformance of emerging markets and Asia ex-Japan equities over the US equities (S&P 500) since late November 2022 has been driven by two main factors; USD weakness and China’s reopening of its economy from its prior stringent zero-Covid policy.
Given the potential short to medium-term USD strength resurgence view as explained above, emerging markets and Asia ex-Japan equities are likely to see some form of near-term weakness at this juncture.
US energy-related equities may face bullish exhaustion
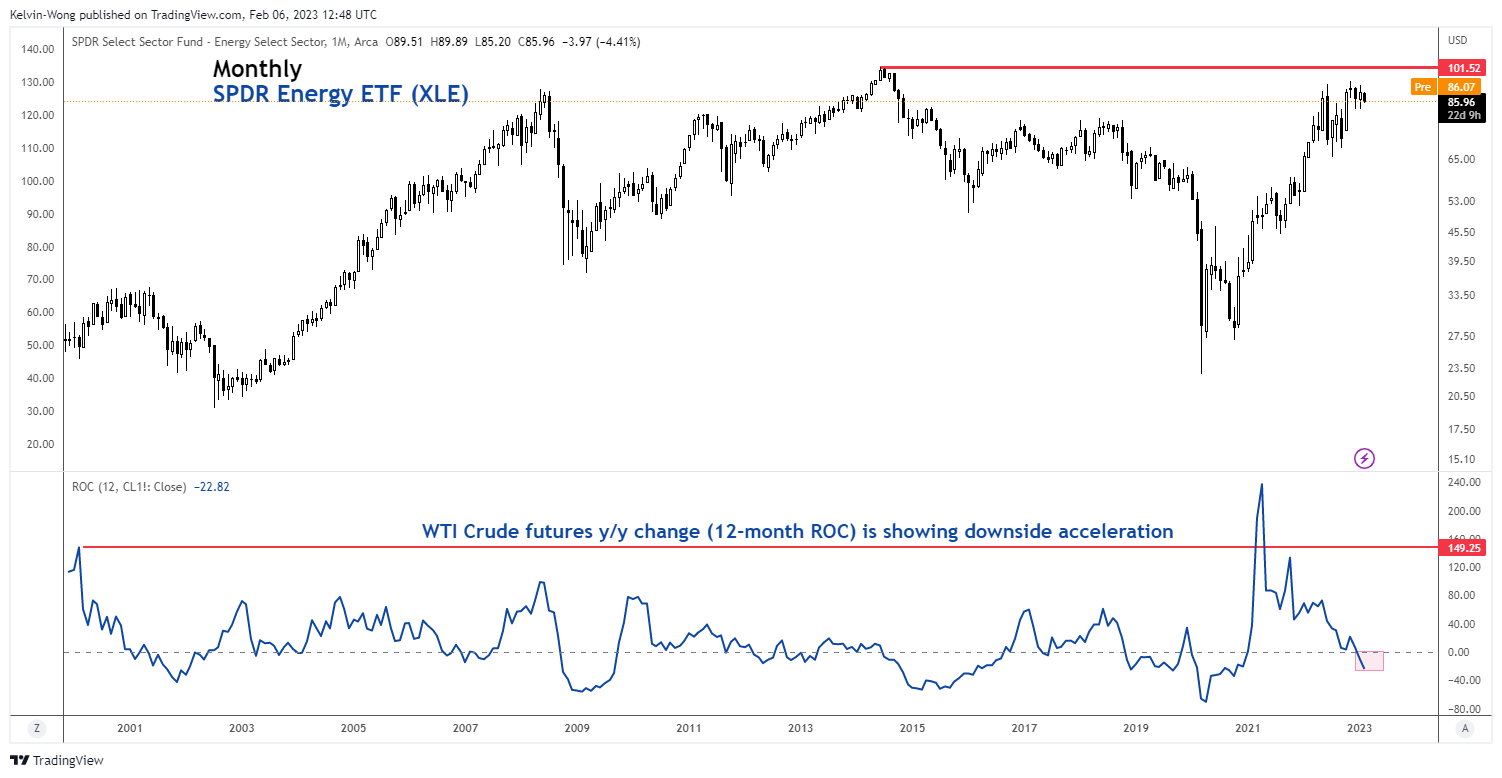
Given the strong direct correlation with price actions of WTI crude oil futures and SPDR Energy Sector ETF (XLE), the lagging movement of the XLE in the recent months is likely to play a downside catch-up with WTI crude as its downside momentum is in acceleration mode now.
The year-on-year change of WTI crude futures has recorded a negative return of -22.86%, its lowest level since October 2020.
US earnings recession is becoming a reality but P/E multiples are still optimistically above average
The focus now shifted back to US Q4 earnings results to decipher the likelihood of an earnings recession. At the midpoint of the Q4 earnings season, the performance of S&P 500 companies continues to be subpar, and based on data from FactSet as of 3 February, the Q4 2020 blended earnings decline for the S&P 500 stood at -5.3% y/y. If -5.3% y/y turns out to be the final number for Q4, it will be the first time the S&P 500 has recorded a year-over-year decline in earnings growth since Q3 2020 (-5.7% y/y).
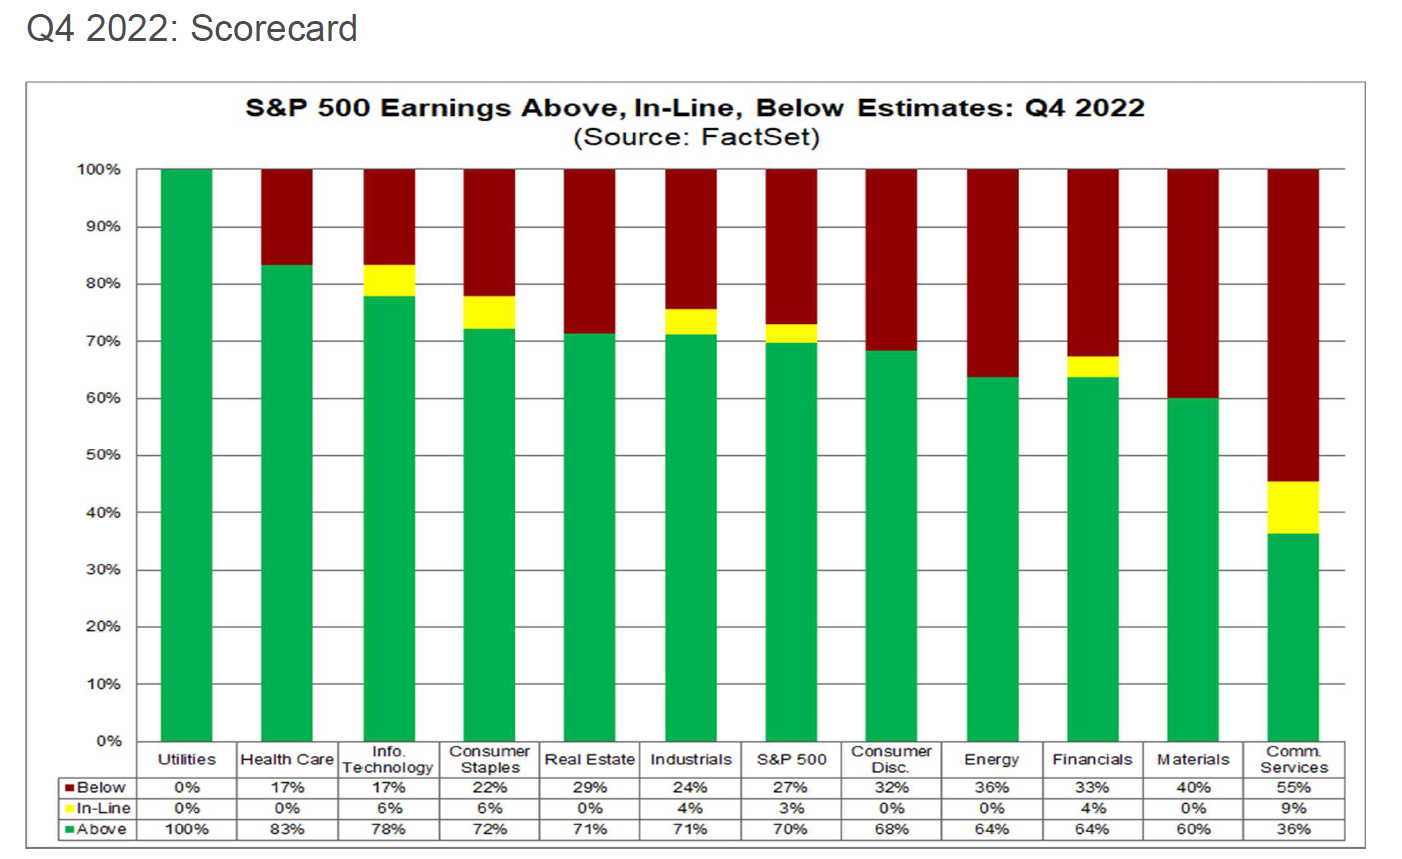
50% of the companies in the S&P 500 have reported their respective actual results for Q4 20222 to date; out of these companies, 70% have reported actual EPS above estimates which is below the 5-year average of 77% and below the 10-year average of 73%. In aggregate, companies are reporting earnings that are 0.6% above estimates, which is below the percentage of 1.5% at the end of last week, below the 5-year average of 8.6%, and below the 10-year average of 6.4%. If 0.6% is the actual surprise percentage for the quarter, it will mark the lowest surprise percentage reported by the index since 2008.
At the sector level, the Utilities (100%) sector has the highest percentage of companies reporting earnings above estimates, while the Communication Services (36%) sector has the lowest percentage of companies reporting earnings above estimates. At the opposite end of the spectrum, Communication Services has the highest percentage of companies (55%) reporting earnings below estimates followed by Materials (40%) and Energy (36%).
Source: FactSet as of 3 February 2023
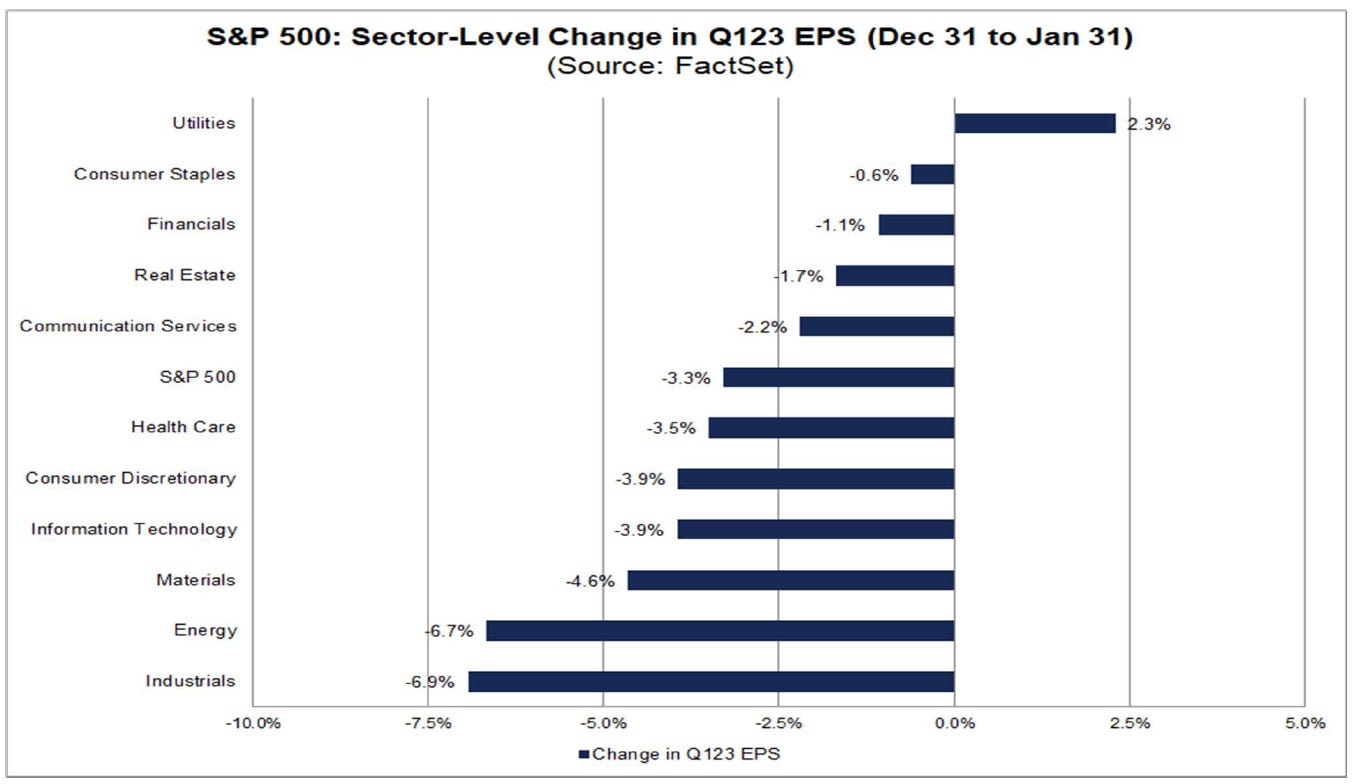
Given the current weakening earnings momentum for Q4 2022, analysts on the aggregate have lowered EPS estimates for Q1 2023 by a larger margin than average; the Q1 bottom-up EPS estimate decreased by 3.3% to $52.41 from $54.20 from the period of 31 December 2022 to 31 January 2023.
The decline in the bottom-up EPS estimate recorded during the first month of the first quarter was larger than the 5-year average, the 10-year average, the 15-year average, and the 20-year average.
At the sector level, ten of the eleven sectors witnessed a decrease in their bottom-up EPS estimate for Q1 2023 from 31 December 2022 to 31 January 2022, led by the Industrials (-6.9%) and Energy (-6.7%). On the other hand, the Utilities (+2.3%) sector was the only sector that recorded an increase in its bottom-up EPS estimate for Q1 2023 during this period.
Source: FactSet as of 3 February 2023
Given the increased momentum in downward reversions of earnings estimates by analysts for Q1 2023, the current valuation of the S&P 500 seems to have not priced in fully such a slowdown in earnings growth. The forward 12-month P/E ratio for the S&P 500 as of 3 February 2023 is at 18.4. This P/E ratio is below the 5-year average (18.5) but above the 10-year average (17.2).
At the sector level, the forward 12-month P/E ratio of the highest weightage Information Technology (23.5) is both above its 5-year (21.9) and 10-year (18.7) averages. Also, the valuation of the Energy sector is the priciest when compared to its forward 12-month P/E ratio (10.1) versus its 5-year average of 3.8.
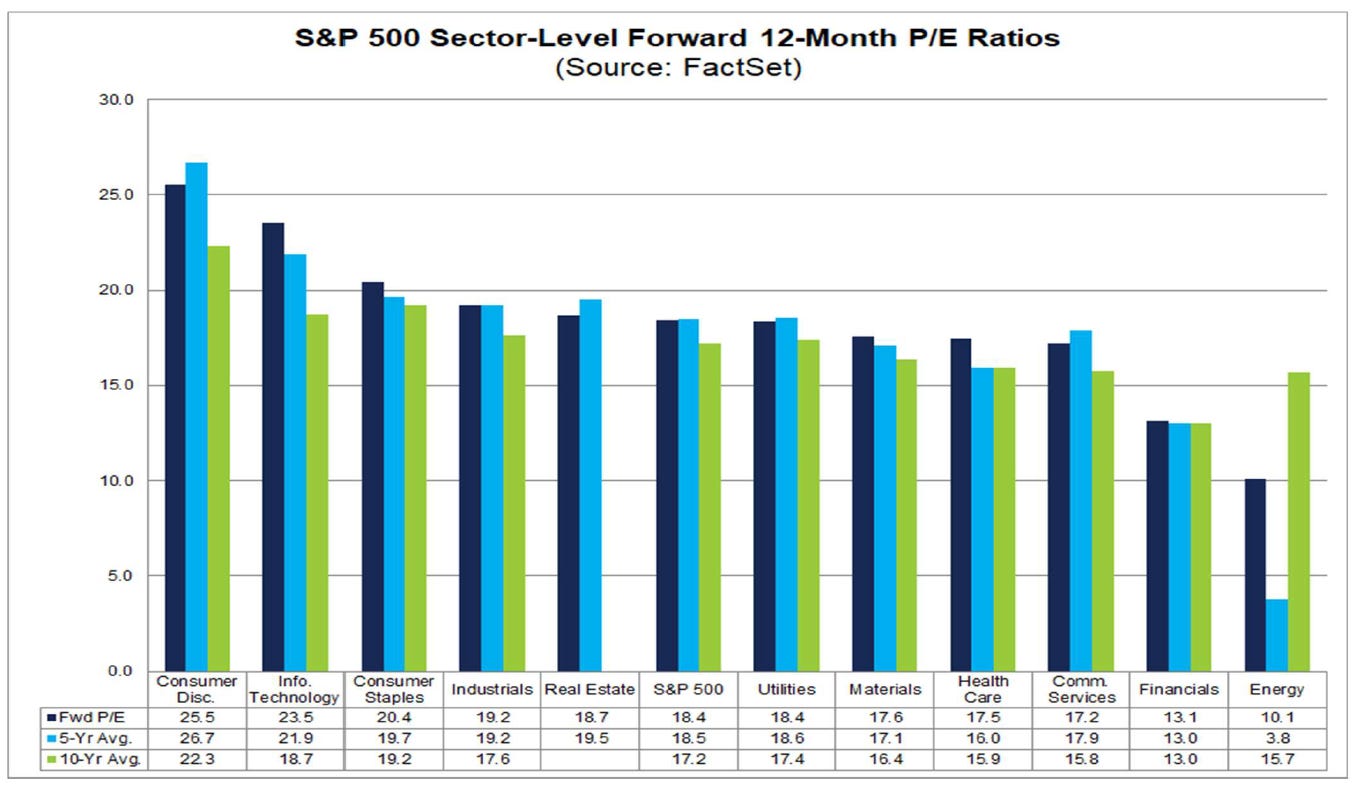
Source: FactSet as of 3 February 2023
Secondly, the price returns of Communication Services (+25%) and Consumer Discretionary (+20%) since 31 December 2022 are the most “stretched” when plotted against their respective change in 12-month forward EPS numbers.
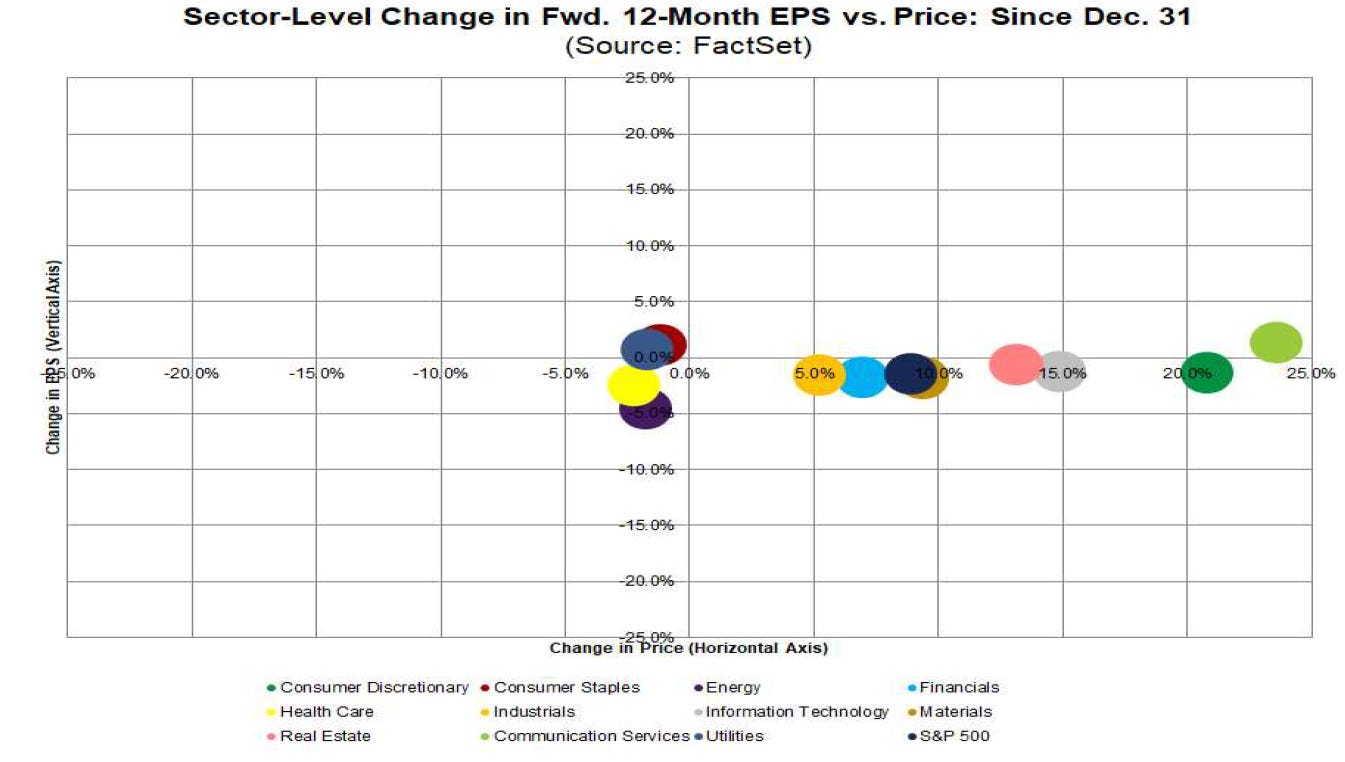
Hence, the S&P 500 is at risk of facing a mean reversion decline at this juncture due to an increase in P/E expansion that seems to be not in line with earnings estimates.
Global Macro Charts Of The Week – curated based on integrated technical analysis (fractals, momentum & graphical)
New additions…
AUD/JPY – Further potential slide within major range configuration
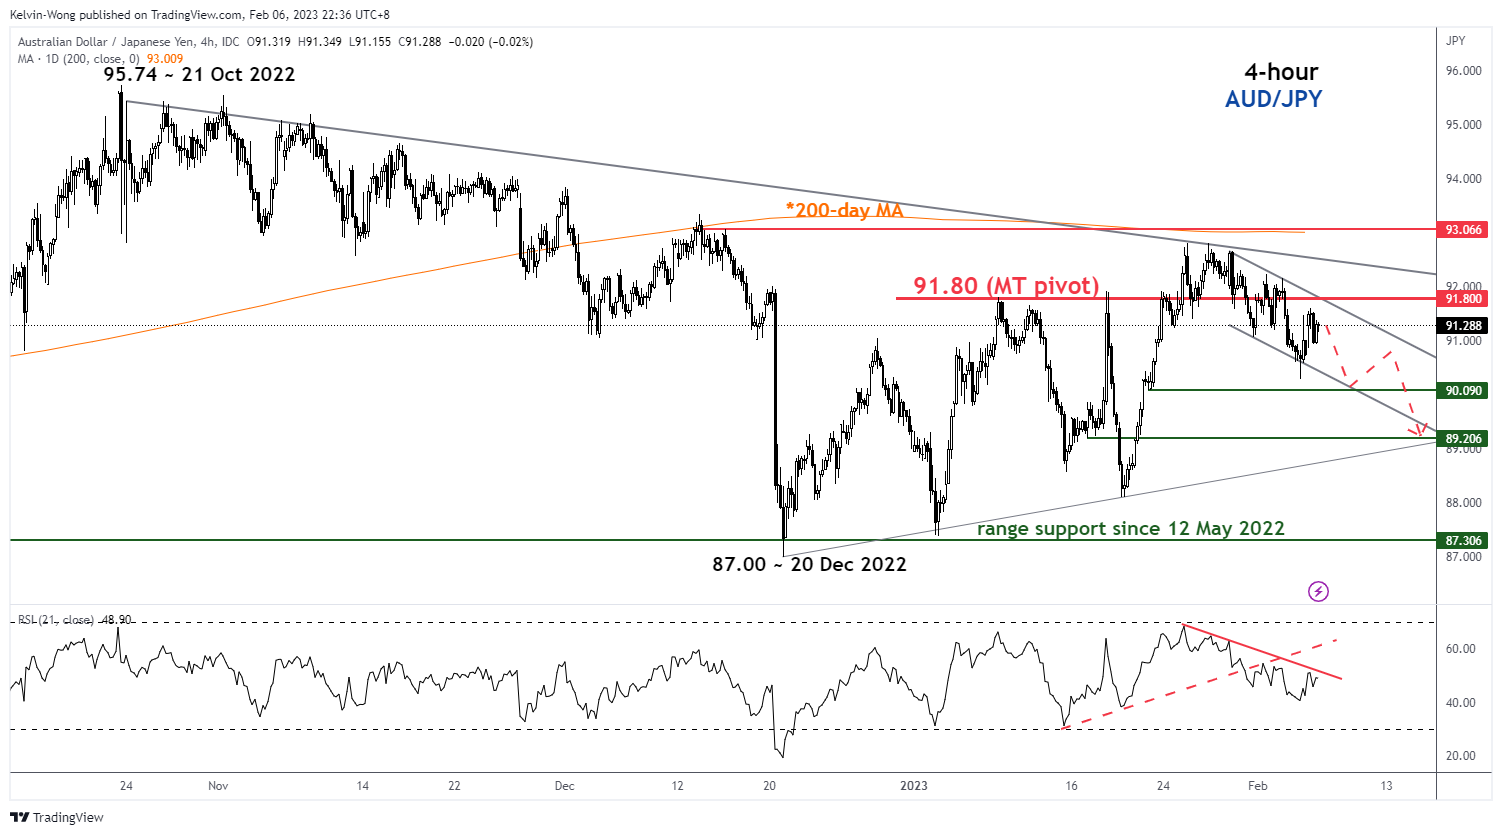
Source: TradingView as of 6 Feb 2023
The three-month up move seen in the AUD/JPY cross pair from its 20 December 2022 low of 87.00 looks rather corrective in nature rather than an impulsive structure to kickstart a major bullish sequence.
Watch the 91.80 medium-term pivotal resistance for a potential slide back down towards the lower portion of the major range configuration in place since the 12 May 2022 swing low with supports at 90.10 and 89.20. However, a clearance with a 4-hour close above 91.80 negates the bearish tone for a squeeze up towards the next resistance at 93.10 (also the 200-day moving average).
Hang Seng TECH Index (futures) – Medium-term uptrend phase has been damaged
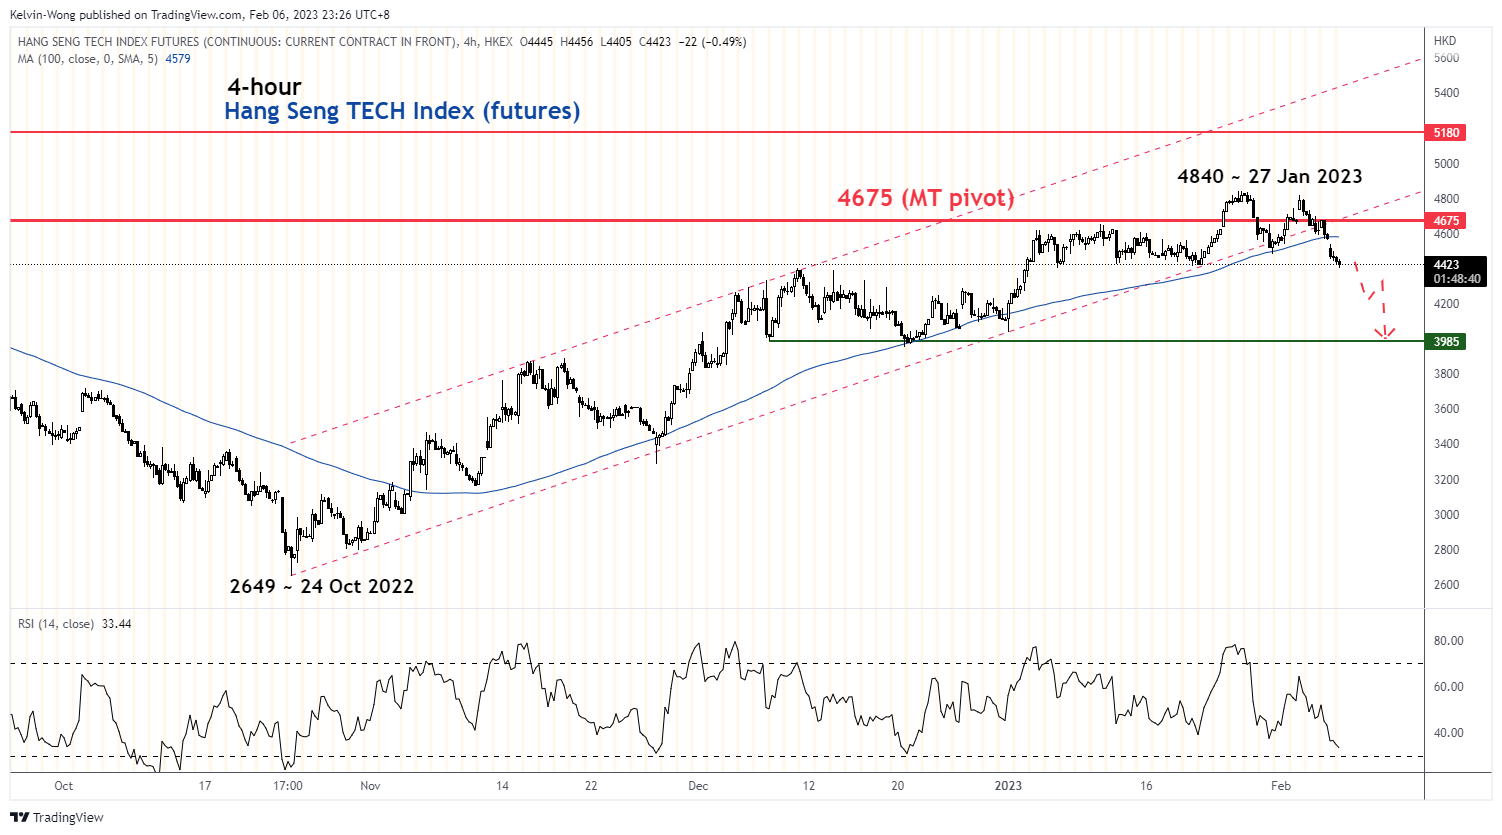
Source: TradingView as of 6 Feb 2023
The medium-term uptrend phase of the Hang Seng TECH Index (futures) has reached its terminal level of 4,840 on 27 January 2023 via the bearish breakdown of its corresponding ascending channel support.
Right now, it is in the motion of undergoing at least a partial retracement of its prior medium-term uptrend within a multi-week time frame. Watch the 4,675 key medium-term pivotal resistance for a further potential decline toward the 3,985 support. On the other hand, a break with a 4-hour close above 4,675 invalidates the bearish scenario for the resurgence of a fresh bullish impulsive sequence to eye the next resistance at 5,180 in the first step.
US SPDR Energy Sector ETF (XLE) – In the midst of undergoing a potential multi-week corrective decline
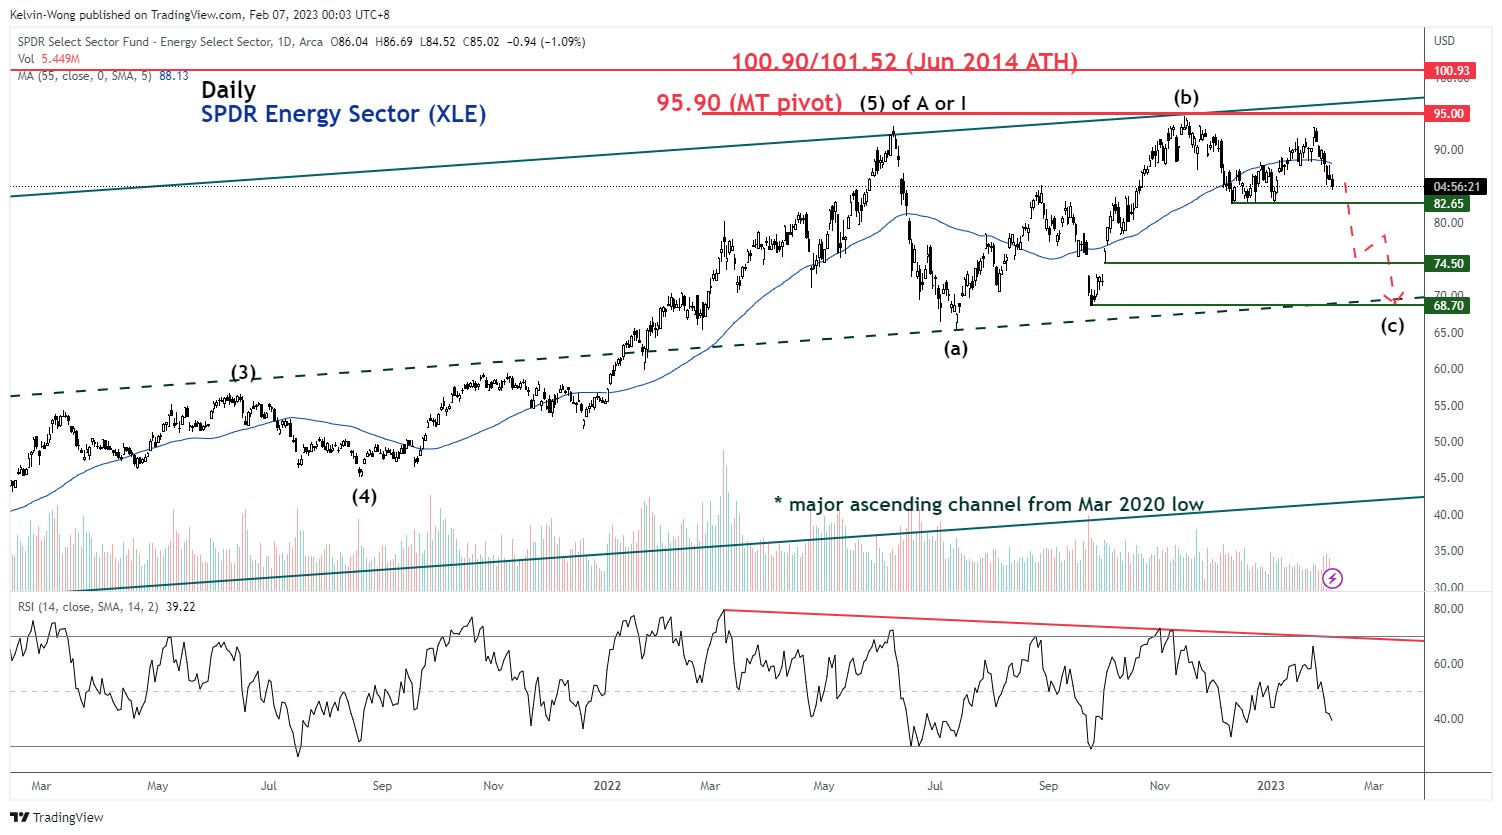
Source: TradingView as of 6 Feb 2023
Since its 14 November 2022 high of 94.71, the technical elements of XLE have deteriorated and the odds of now skewed towards a multi-week corrective. A break below 82.65 intermediate support opens up the scope for a further potential decline toward 74.50 followed by 68.70.
However, a break with a daily close above 95.90 key medium-term pivotal resistance invalidates the bearish tone for a push-up to retest its current all-time high zone of 100.90/101.52 printed in June 2014.
Short-term Tactical Global Macro Model Portfolio
Below is a summary table of assets from prior newsletters’ “Global Macro Charts Of The Week”
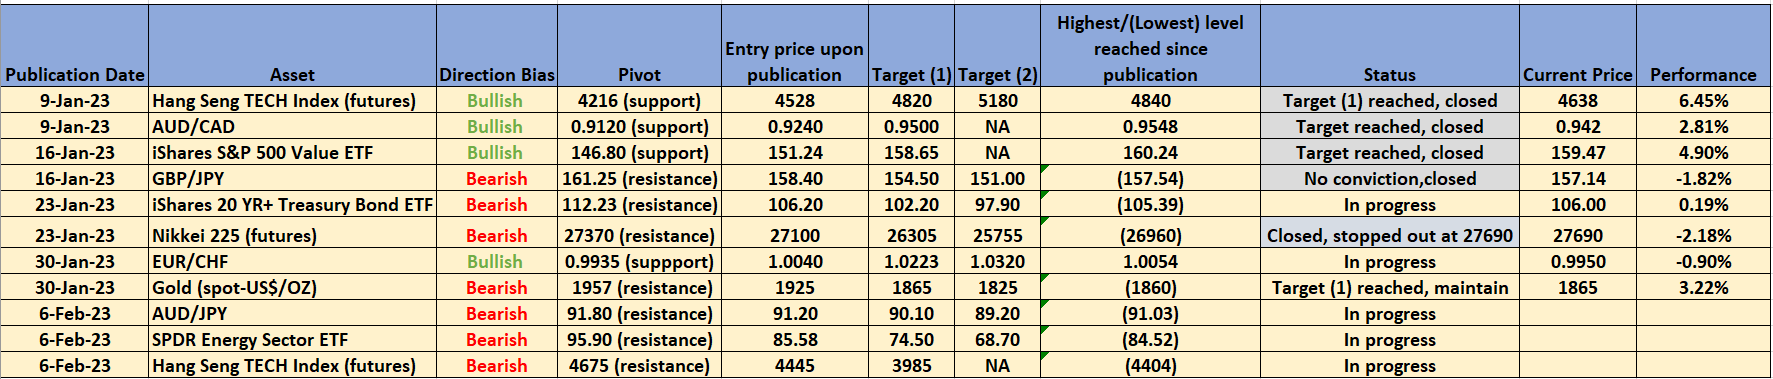
Source: TradingView as of 6 Feb 2023
Disclaimer
The content of this newsletter should not be construed as a solicitation to invest and/or trade. This is not trading/investment advice and all content is portrayed as opinion. Past performance is not indicative of future performance.
That’s all for today. I hope you enjoyed my analysis; do feel free to forward it to your friends, and colleagues. Remember to subscribe to the newsletter for the latest updates.
gold👍