

Greetings folks! Welcome to the latest edition of the “Global Macro Weekly Playbook” newsletter; it will be a shorter version as yours truly, the Lighthouse MacroWatcher is being tasked to play the “banker” for a few rounds of social games; Blackjack, and a giver of the auspicious “red packets” in this week-long of reveling to usher in the 2023 lunar new year of the Water Rabbit.
For those who are celebrating the Spring Festival, I wish you and your loved ones a blessed lunar new year ahead with good health, happiness, and abundance.
Recap for last week…
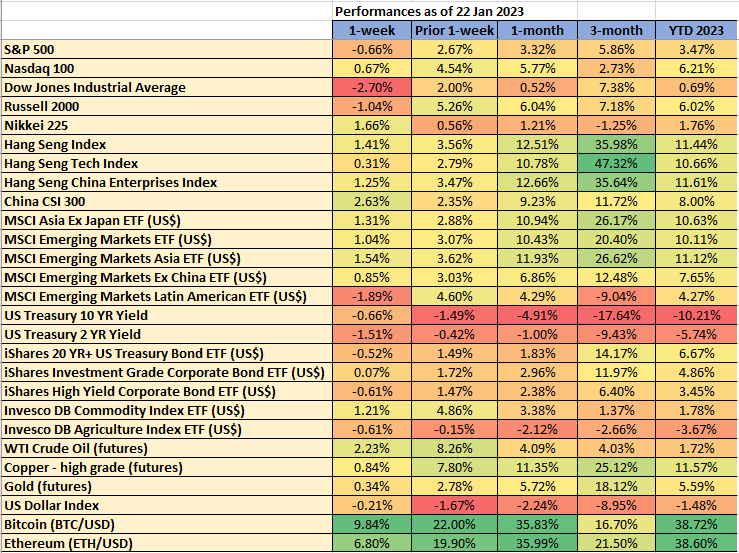
Data from TradingView & MarketWatch
Despite a strong push-up seen in the US tech and growth proxy Nasdaq 100 last Friday which has recorded a daily gain of 2.86%, its best single-day performance seen in the past two months, its weekly performance together with the other US benchmark stock indices have turned lackluster, their weakest performance since the week of 2 January 2023. The underperformer was the Dow Jones Industrial Average with a weekly loss of -2.7% (almost three times below the other US stock indices) and its worst weekly performance since 5 December 2022.
Interestingly, the Dow Jones Industrial Average has been the strongest among the major US stock indices since the start of this corrective rally phase from their respective 13 October 2022 lows; rallied by 20.88% and last week’s signs of a bullish exhaustion signal from the “leading DJIA general” is likely to indicate that the on-going corrective phases of the US stock indices are coming towards their respective tail-ends.
I have highlighted in my prior weekly newsletter for the week of 16 January that the downside momentum of the US Treasury yields (2-year & 10-year) has started to abate where the current bout of “risk-on fantasy” may start to face a roadblock soon. Last week, the US 10-year Treasury yield has flashed out a bullish signal; a weekly bullish “Hammer” candlestick pattern right at the predefined key pivotal support zone of 3.44%/3.30%.
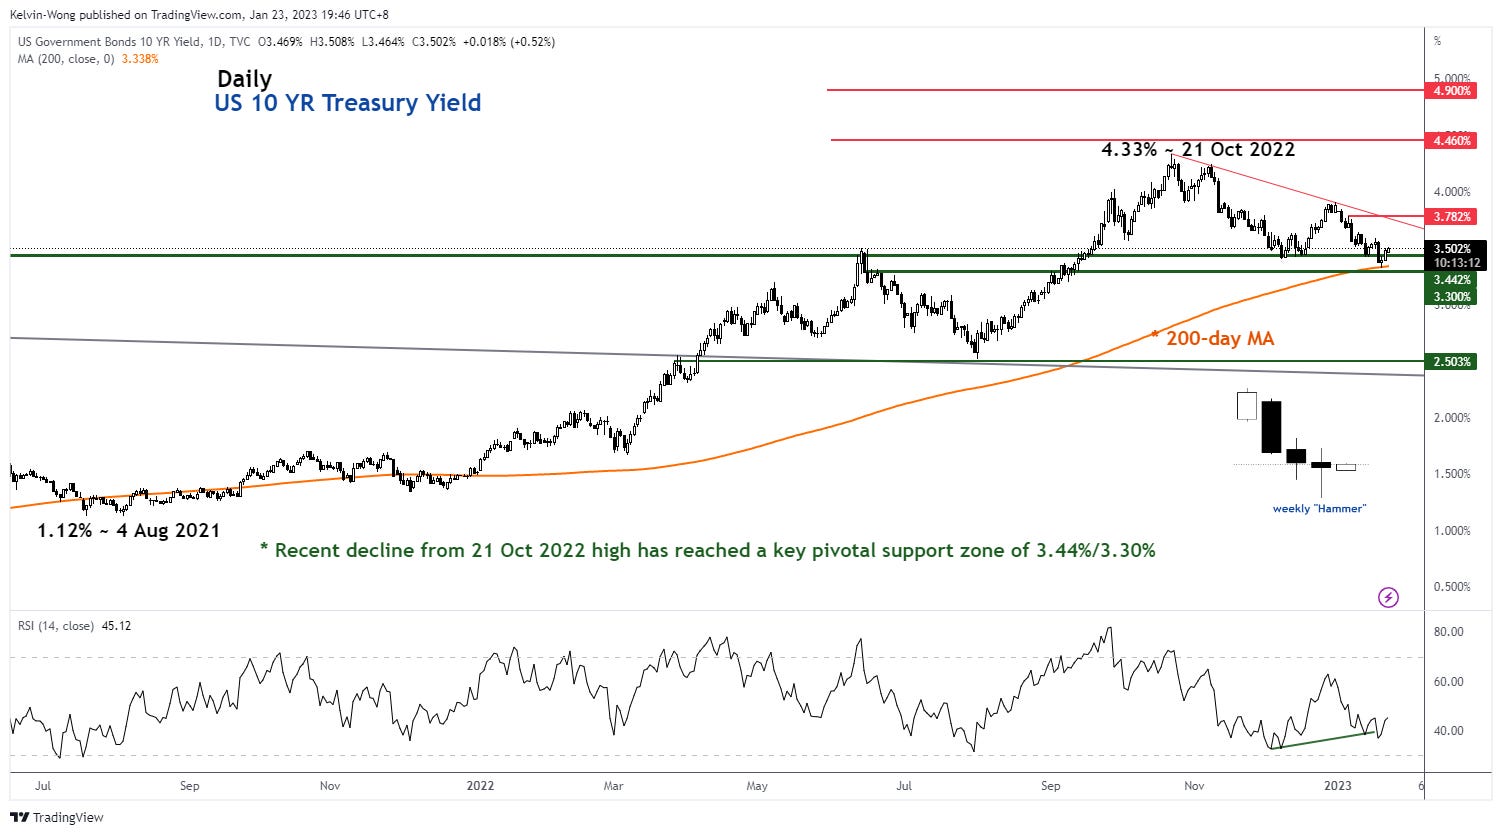
Source: TradingView as of 23 Jan 2023
Hence, the asset class to watch out for this week will be within the fixed income space especially the longer-dated US Treasury bonds, as well as the riskier high-yielding corporate bonds as their bond prices are the most sensitive to Treasury yields (based on the mechanics of bond duration); they react adversely to a rise in US Treasury yields.
Meanwhile, Asia and emerging markets equities with the exception of Latin America outperformed the US in general as China’s reopening and liquidity support-driven policies narrative continue to take center stage.
US Q4 2022 earnings session: Microsoft, a bellwether US Big Tech will report its numbers after the US market closes on Tuesday, and Tesla, the closely watched “poster boy” stock of the post-pandemic releases its earnings after the close on Wednesday. Other notable firms to watch out; such as Boeing, Visa, Mastercard, American Express, Texas Instruments, and Chevron. A full table of details as below;
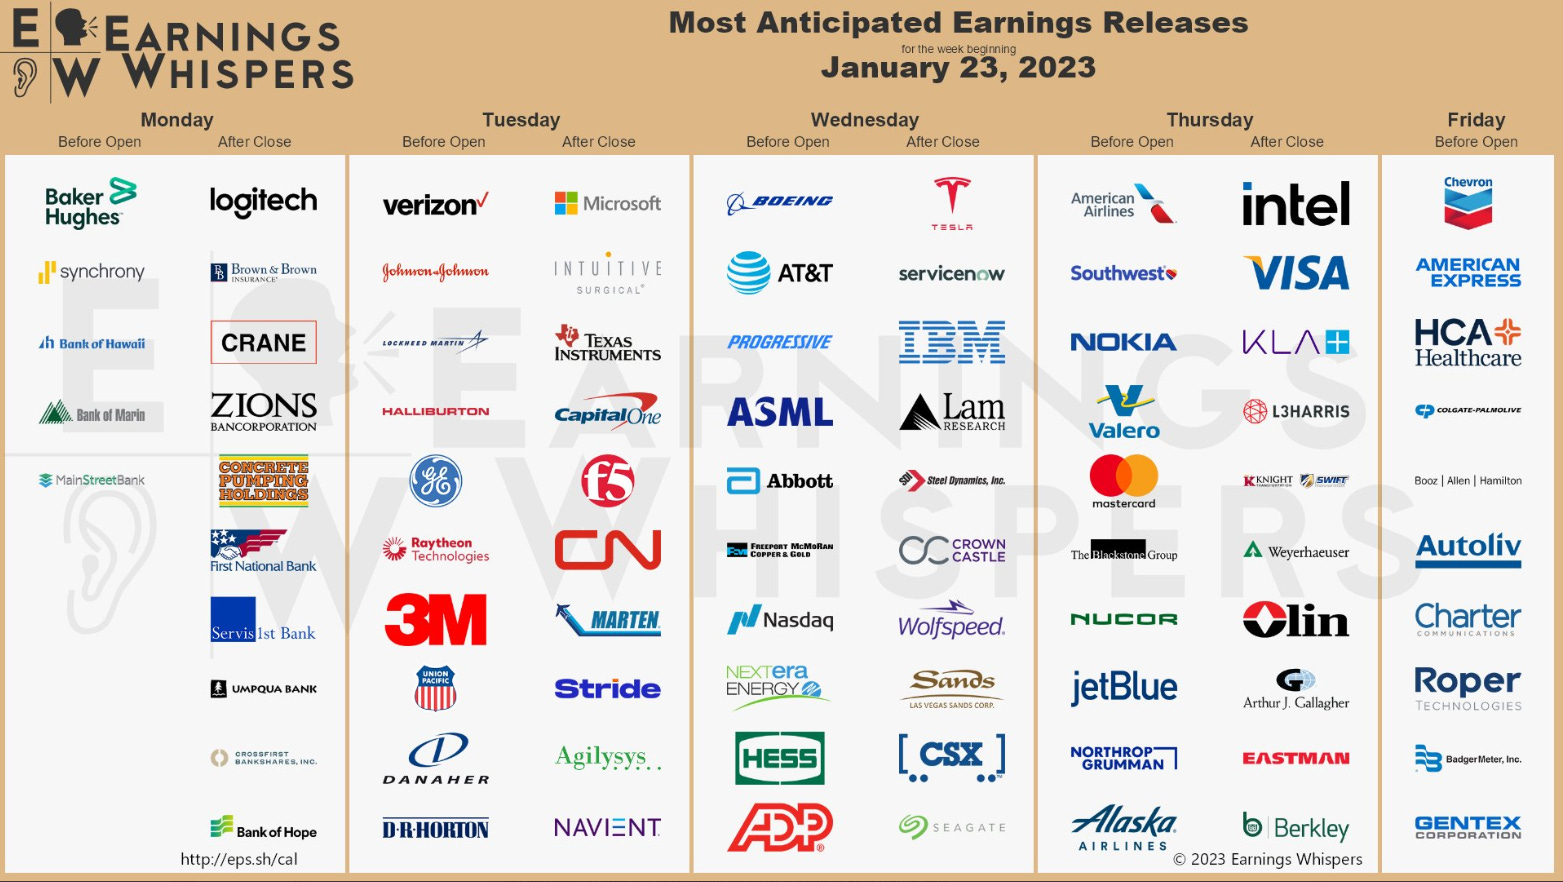
Source: Earnings Whispers
Global Macro Charts Of The Week – curated based on integrated technical analysis (fractals, momentum & graphical)
New additions…
iShares 20+ year Treasury Bond (TLT) – Bullish momentum is showing exhaustion
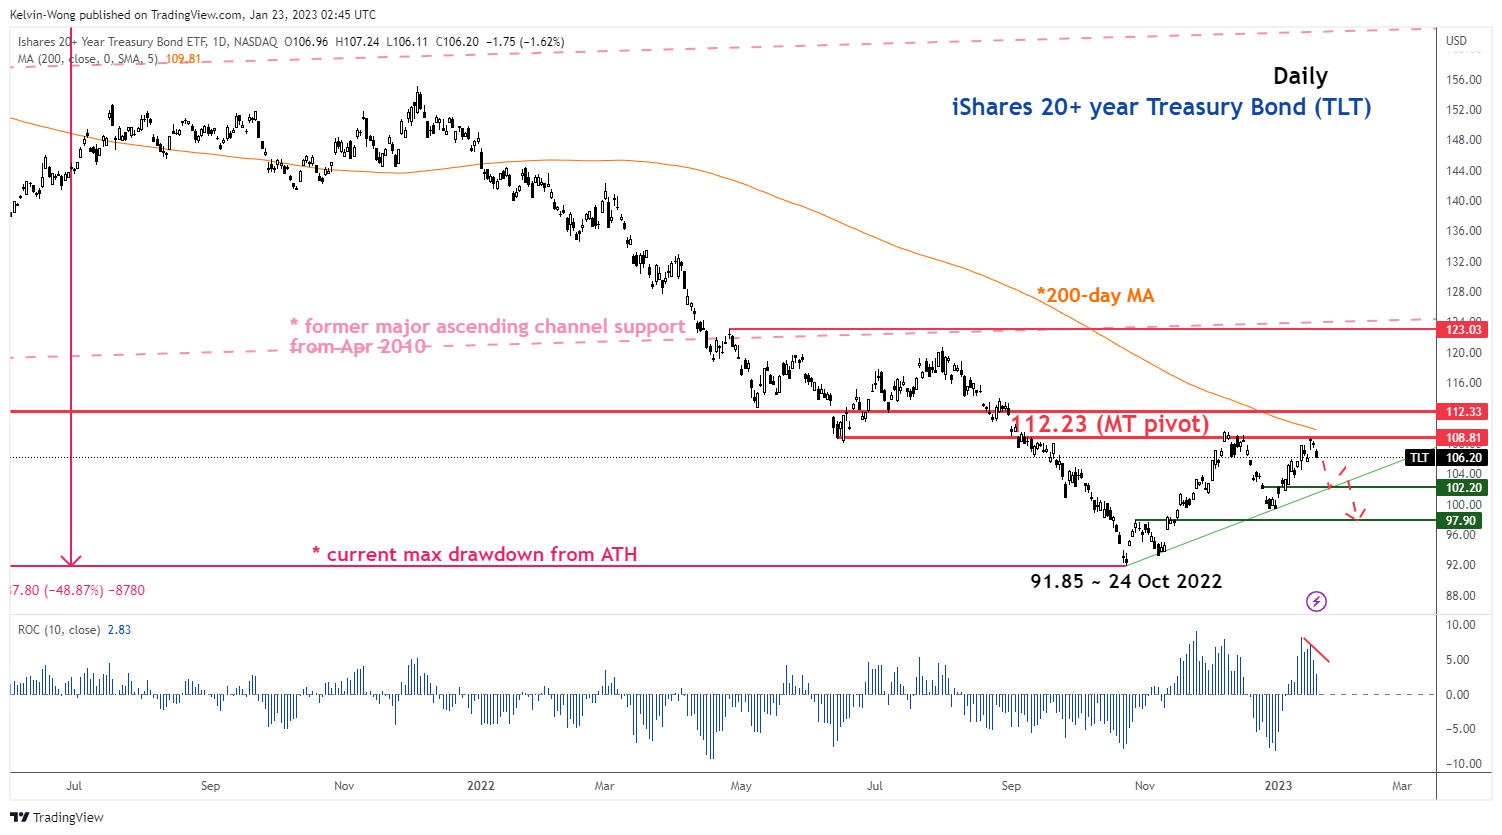
Source: TradingView as of 20 Jan 2023
The current short-term up move from its 28 December low of 99.35 has now reached a key medium-term “roadblock”/medium-term pivotal resistance for a reality check where price actions confluences with several key elements; fractals (Fibonacci retracement & extension), mathematical (200-day MA) and graphical (swing high area 7 Dec/15 Dec 2022) coupled with a bearish divergence seen in the daily 10-period ROC indicator
Bearish bias below 112.23 medium-term pivotal resistance for a potential multi-week decline; a break below 102.20 adds impetus for a further slide towards 97.90 next. On the flip side, a daily close above 112.23 invalidates the bearish scenario for an extension of the corrective rally to target the next resistance at 123.00.
Nikkei 225 (futures) – Potential decline towards medium-term range support
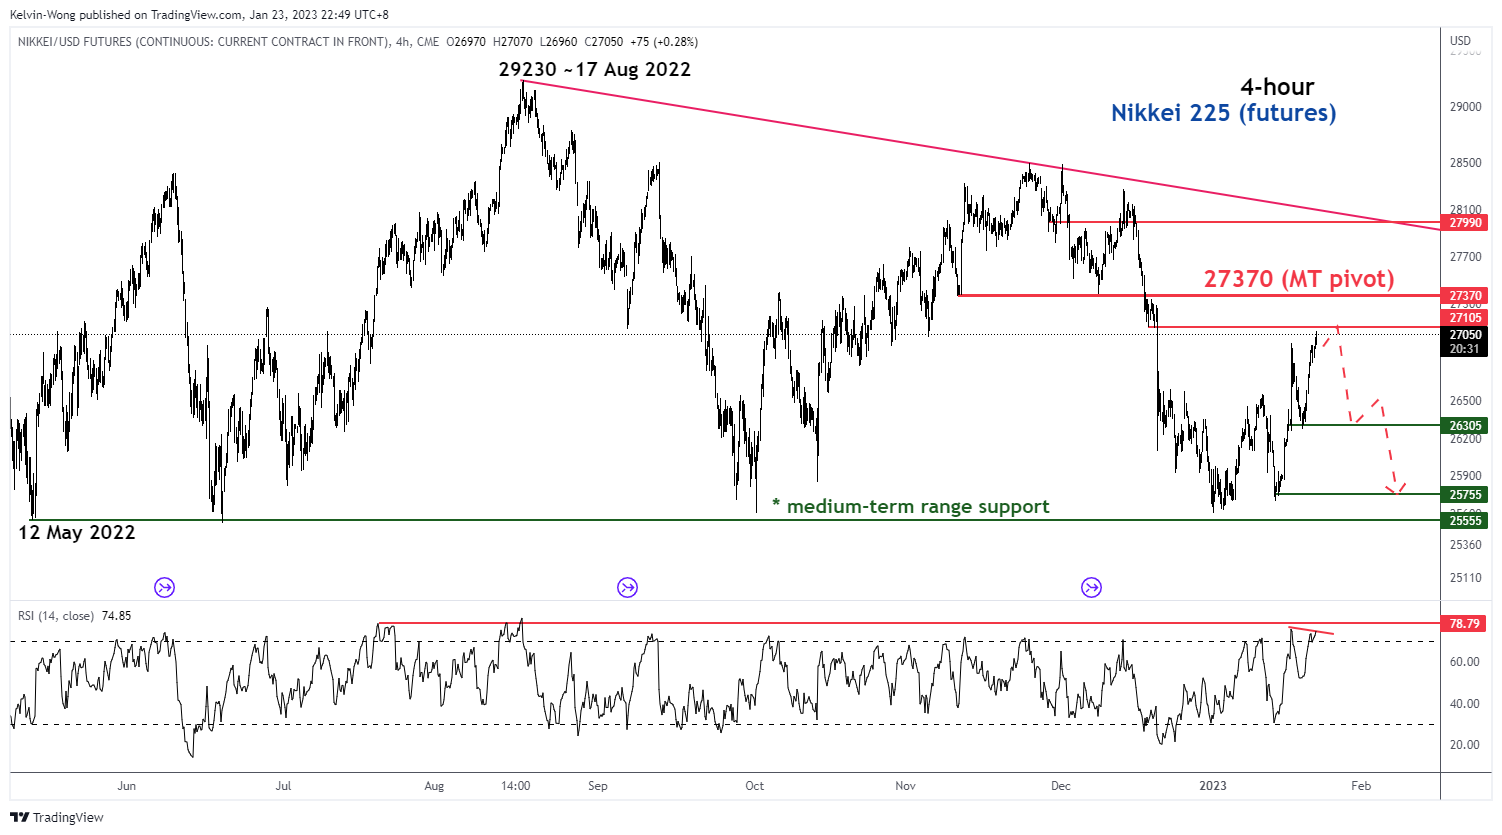
Source: TradingView as of 23 Jan 2023
The 3-week rally of the Nikkei 225 futures within a medium-term range configuration is now showing signs of fatigue as indicated by fractals (Fibonacci retracement & extension and momentum signal (bearish divergence within an extreme overbought condition seen in the 4-hour RSI).
Watch the 27,370 key medium-term pivotal resistance for a potential mean reversion decline to retest the supports at 26,305 and 25,755. However, a break with a 4-hour close above 27,370 invalidates the bearish scenario for a squeeze up toward the next resistance at 27,990.
Short-term Global Macro Model Portfolio
Below is a summary table of assets from prior newsletters’ “Global Macro Charts Of The Week”
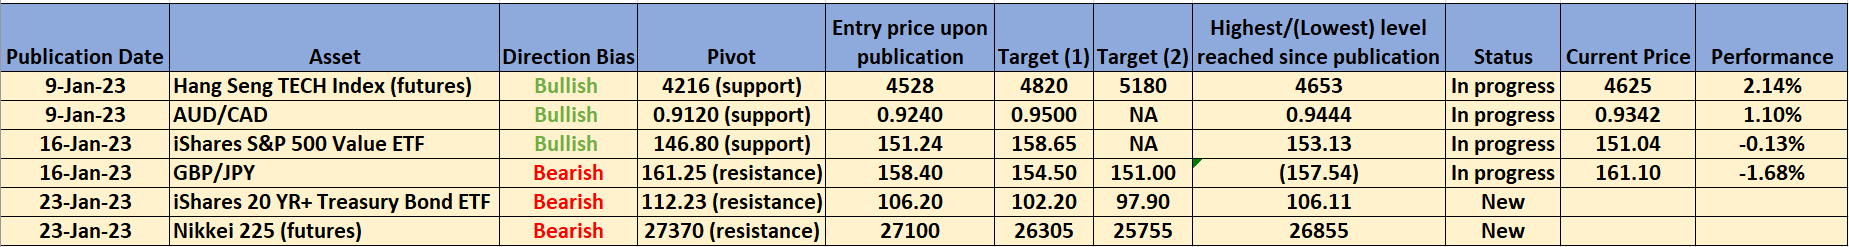
Source: TradingView as of 23 Jan 2023
Disclaimer
The content of this newsletter should not be construed as a solicitation to invest and/or trade. This is not trading/investment advice and all content is portrayed as opinion. Past performance is not indicative of future performance.