
Global Macro Weekly Playbook (21 Feb)
Defensive over offensive

Greetings folks! Welcome to the latest edition of the “Global Macro Weekly Playbook” newsletter where we will be taking a deep dive into the common narratives to uncover macro mispricing and how it impacts the broad-based asset classes from a tactical perspective.
Recap for last week…
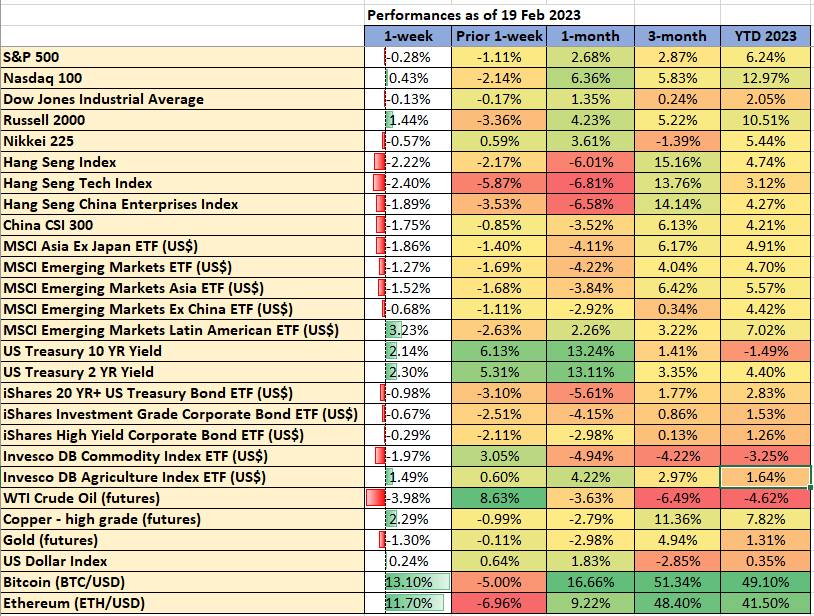
Data from TradingView & MarketWatch
Key economic data & events to watch for this week
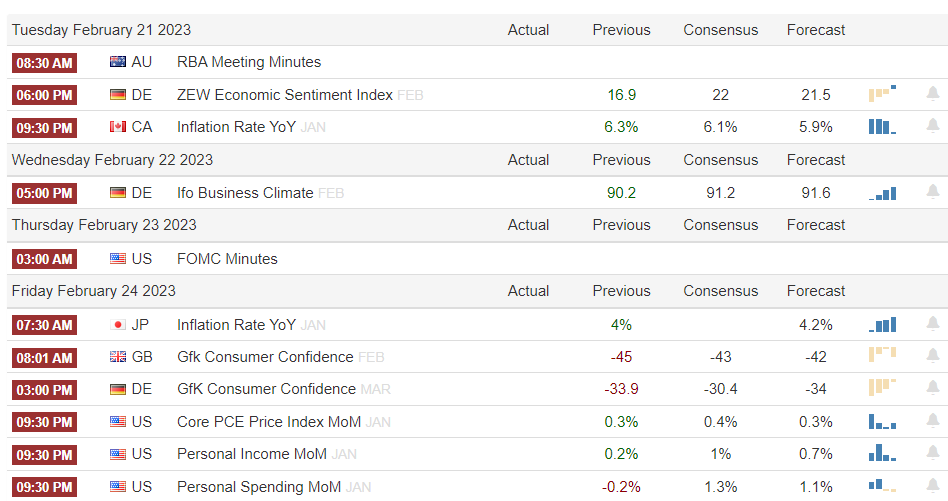
Source: Trading Economics (SG timing)
Other notable key economic data and events to watch:
Flash February Manufacturing & Services PMIs for Japan, Eurozone, UK, and US on Tuesday, 21 February.
Bank of Japan Governor Kazuo Ueda will be speaking in a confirmation hearing at the lower house of parliament on Friday, 24 February; giving investors clues as to how he will steer the monetary policy that is widely expected to move toward normalization after a decade of extraordinary easing under current Governor Haruhiko Kuroda.
US Q4 2022 earnings season: key firms to watch for this week will be Walmart, Coinbase, Toll Brothers, Fiverr, Etsy, NVIDIA, Nikola, and Moderna. A full table of notable reporting firms is as follows;
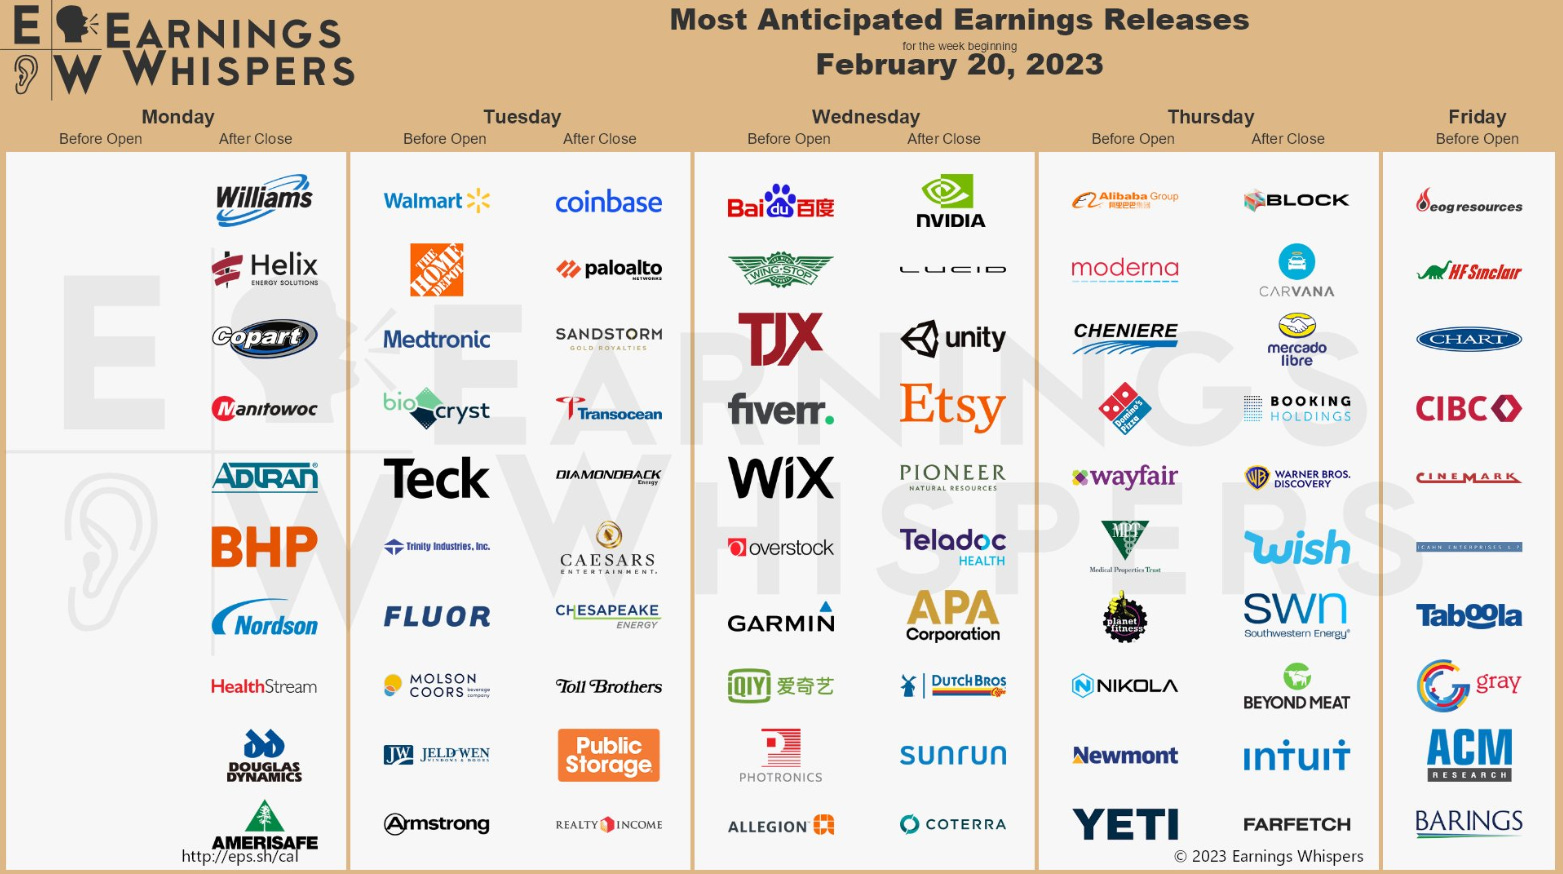
Source: Earnings Whispers
China Big Tech earnings releases on the horizon: Baidu (Wednesday, 22 February), Alibaba & NetEase (Thursday, 23 February)
Going forward...
Looks like higher levels of inflation are here to stay in the US after the recent January CPI data print. Here are some interesting inflationary statistics apart from the usual CPI.
US Median CPI (stripped out of the biggest outliers’ components) is still rising
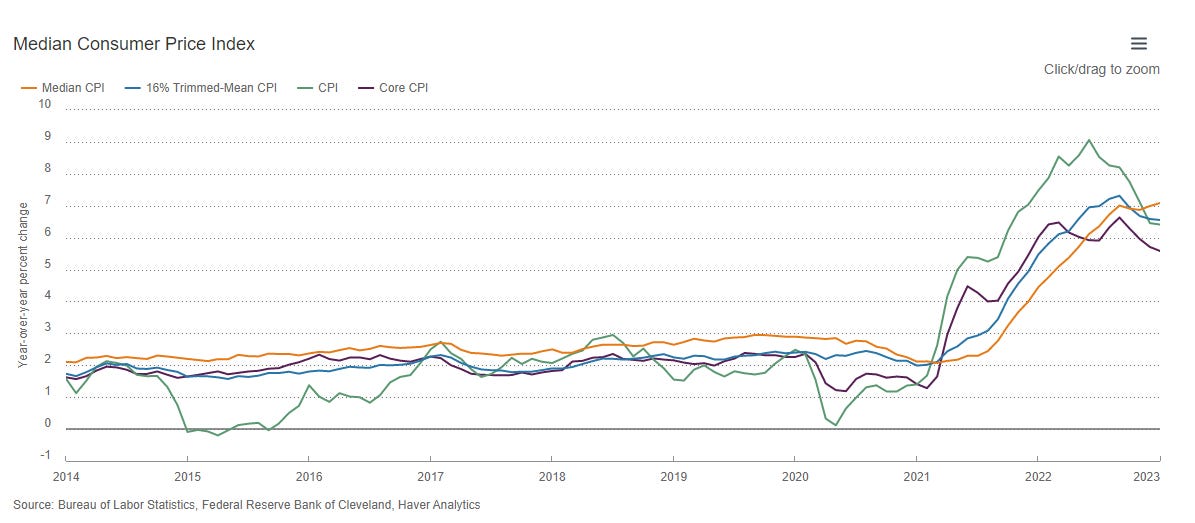
Cleveland Fed’s median CPI has recorded a +7.1% y/y in January 2023 from +7% in December 2022 and +6.9% y/y in November 2022
US Sticky CPI (measures goods & services whose prices need to be set well in advance and are difficult to change quickly) has remained elevated as well
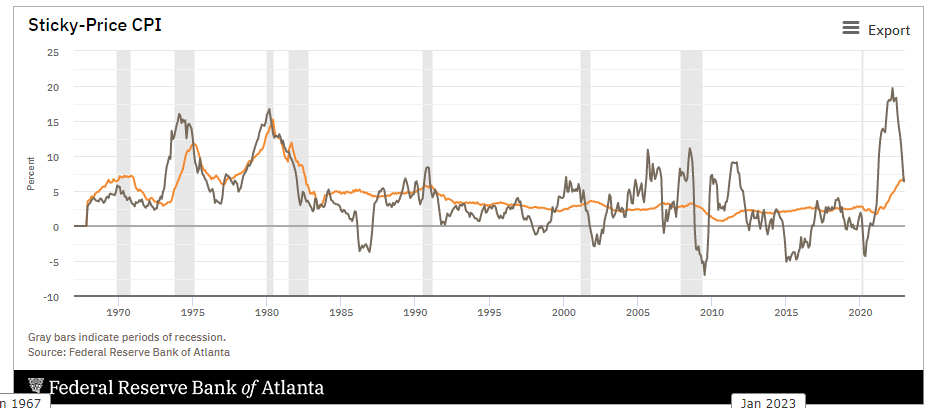
Atlanta Fed’s sticky-price CPI rose by +6.7% y/y in January 2023, unchanged from December 2022 and it was the highest level recorded in almost 41 years.
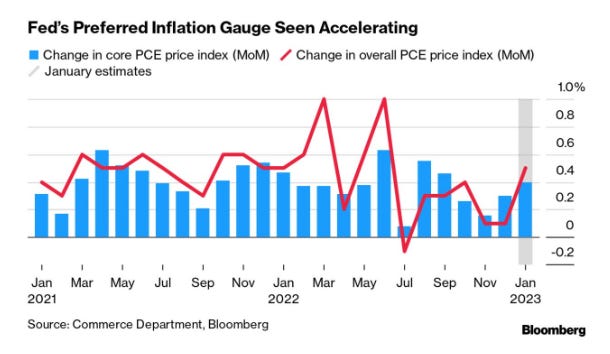
Given the “hotter prints” seen in the median and sticky CPI data, the Fed’s preferred inflation gauge (PCE price index for January) due on Friday, 24 February is expected to accelerate to +0.4% m/m for its core component (excluding food & energy), up from +0.3% m/m printed in December 2022.
This change of wind on US inflationary data has professional forecasters and bond/fixed-income traders dialled back on their expectations for the earlier “Fed Pivot” narrative that gained a foothold at the start of the year. Some Wall Street economists now expect the Fed funds rate to peak at 5.6% in the current interest rate hiking cycle, above the 5.1% previously forecast with the current range at 4.5% to 4.75%.
Market-driven implied expectations have priced in a higher terminal Fed funds rate
Fed funds rate futures have priced an increase in probability for a peak rate of 5.25% to 5.50% and the forward curve indicated 5.295%; the significance of such market-driven implied expectations have indicated for the first time in the current interest rate hiking cycle, the market is pricing in more hikes than the current Fed’s median dot plot projection of Fed funds rate at 5.1% for 2023 released on the December 2022 FOMC meeting.
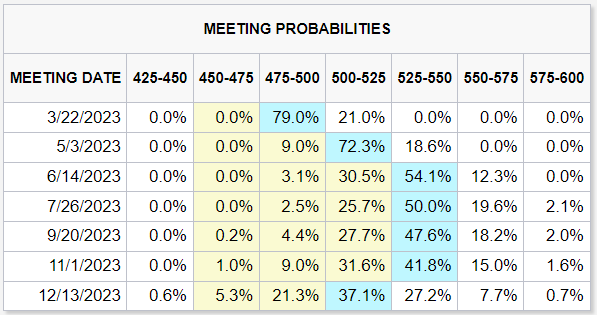
Source: CME FedWatch Tool as of 20 Feb 2023

Source: Bianco Research
Implications for the US stock market - Low Volatility factor is likely to shine again
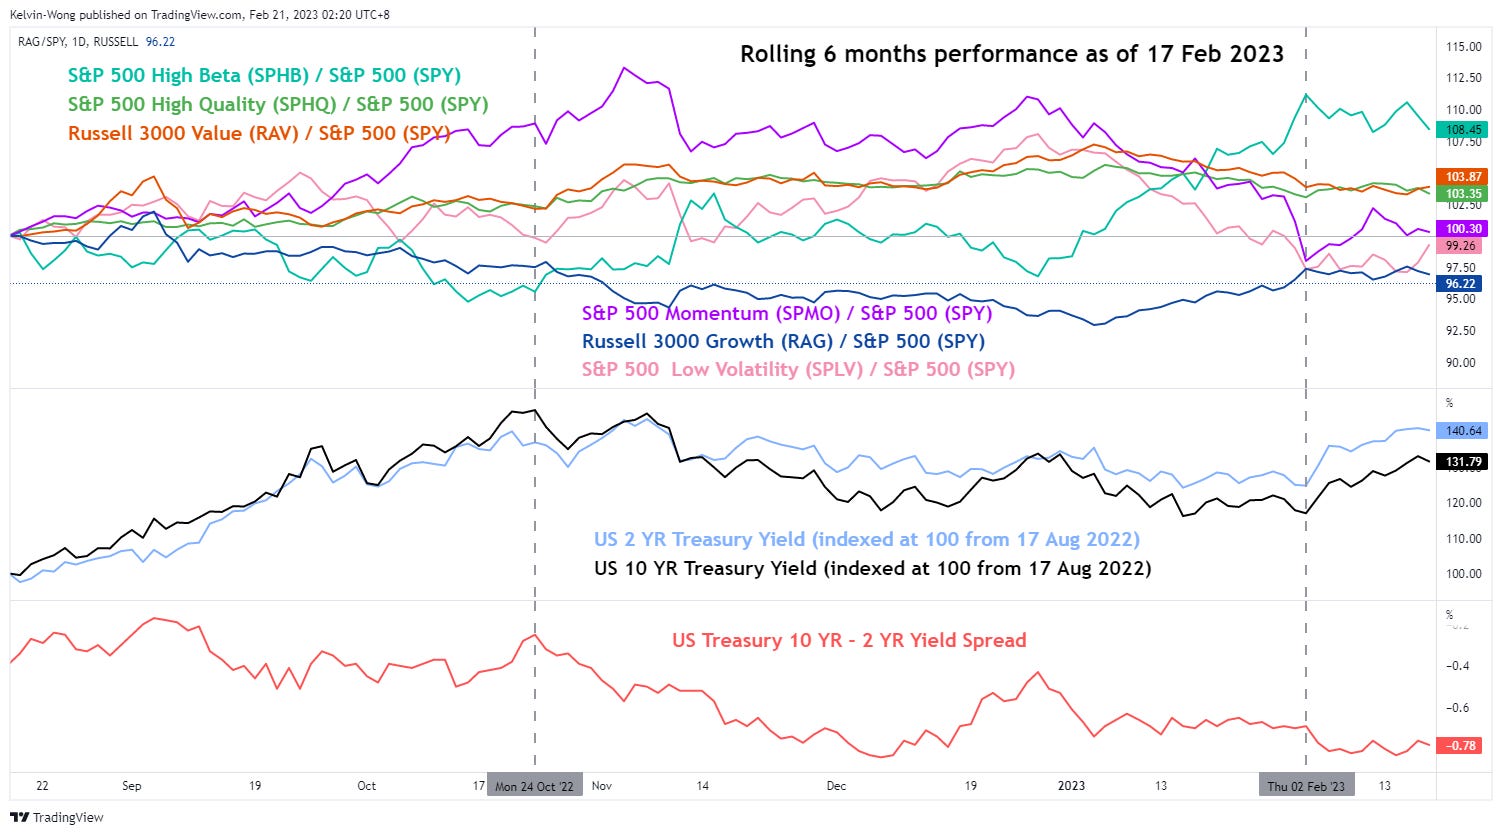
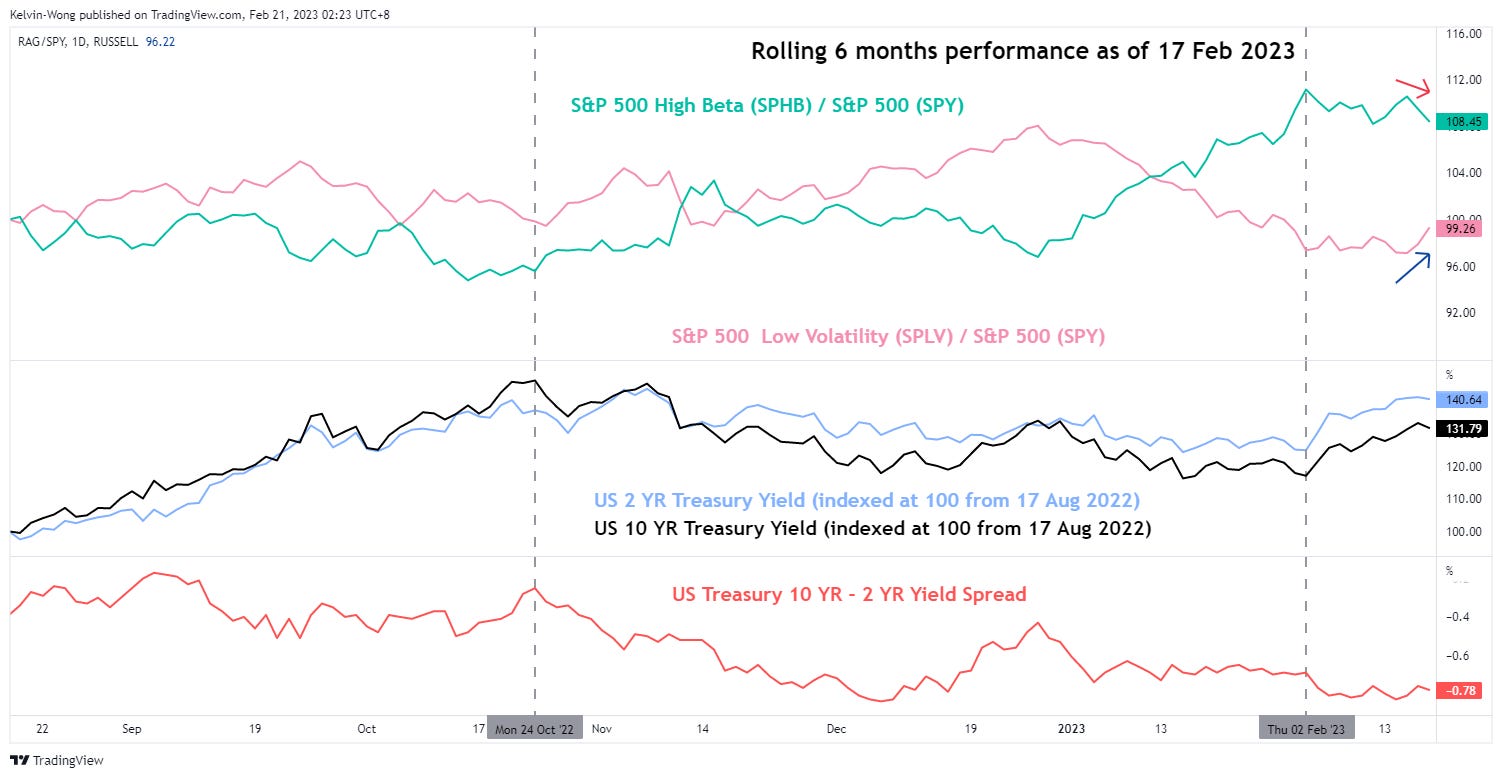
Source: TradingView as of 17 Feb 2023
Plotted a 6-month rolling relative performance of 6 factor-based ETFs and indices against the S&P 500 (as ratios) overlayed with the US 2-year and 10-year Treasury yields as well as 10-2-year Treasury yield spread.
The 6 factors-based ETFs/indices are High Beta, High Quality, Momentum, Low Volatility, Value, and Growth.
Interestingly, the earlier outperformance of High Beta has started to diminish since 2 February 2022 and in contrast, the underperformance of Low Volatility has been reduced since 2 February 2022. These observations on the factors have coincided with the bullish reversal seen in the 2-year and 10-year US Treasury yields which took shape earlier than last week’s repricing of the “Fed Pivot” narrative.
Hence, the recent uptick in the pricing of the Fed funds terminal rate is likely to induce another spiral of positive feedback loop into the 2-year and 10-year -year US Treasury yields that lead to higher yield levels potentially. Thus, the Low Volatility factor which is considered a defensive play is likely to outperform in the coming weeks while the offensive High Beta factor takes a backseat.
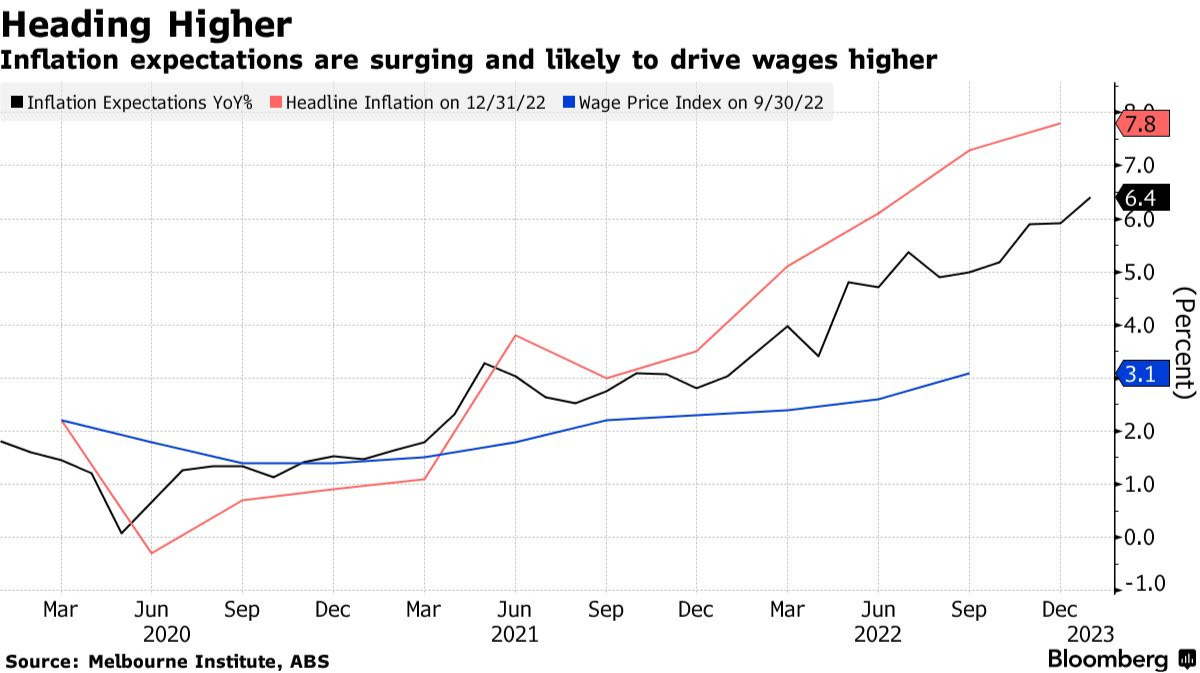
No dovish pivot yet in Aussie Land
Inflationary expectations in Australia have continued to surge; jumped to a record high of 6.4% y/y in January from 5.9% y/y in December 2022 based on data compiled by the Melbourne Institute. This leading inflationary factor is likely to trigger the lagging wage price index upwards (+3.1% y/y in Q3 2022; its highest reading since Q1 2013) which will add to further inflationary pressures in the Australian economy in the months ahead.
The Australian central bank, RBA has lagged behind its developed nation peers and even its “Kiwi neighbour-RBNZ” in terms of the pace of interest rate hike hikes in the current global monetary policy tightening cycle.
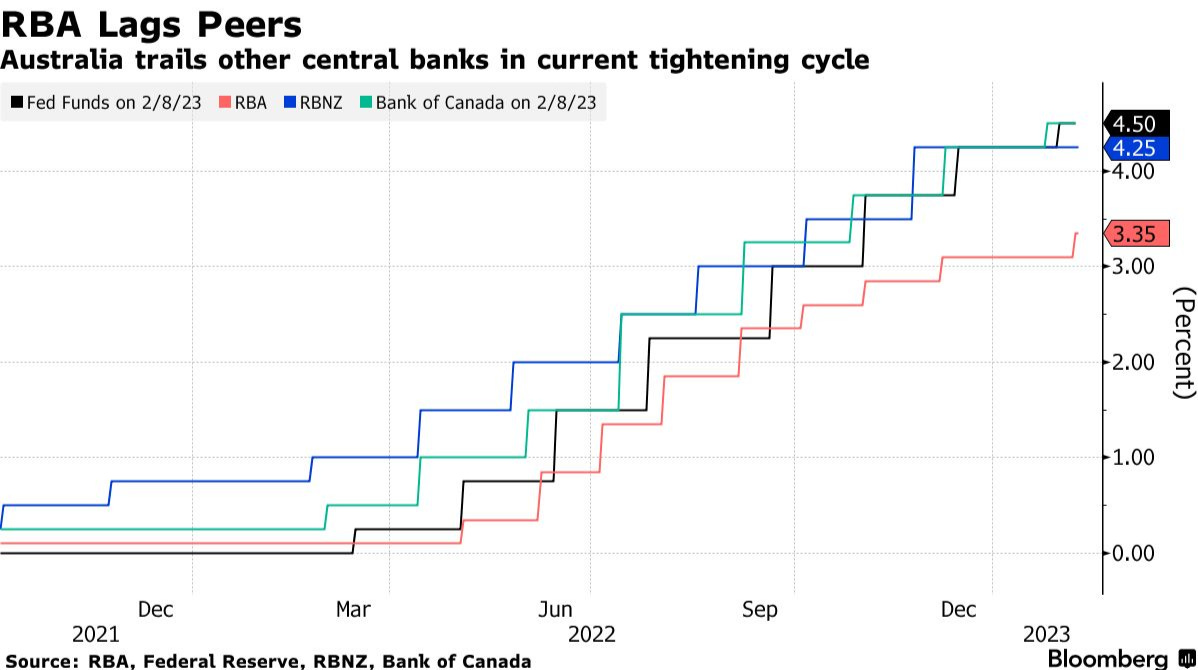
RBA’s policy cash rate is at 3.35% which is still way below the core inflation rate which grew at 6.9% y/y in Q4 2022, its highest print since Q1 1991. In addition, upward demand-pull pressures from China’s reopening are likely to also feed a positive inflationary feedback loop into the economy as China is Australia’s biggest trading partner.
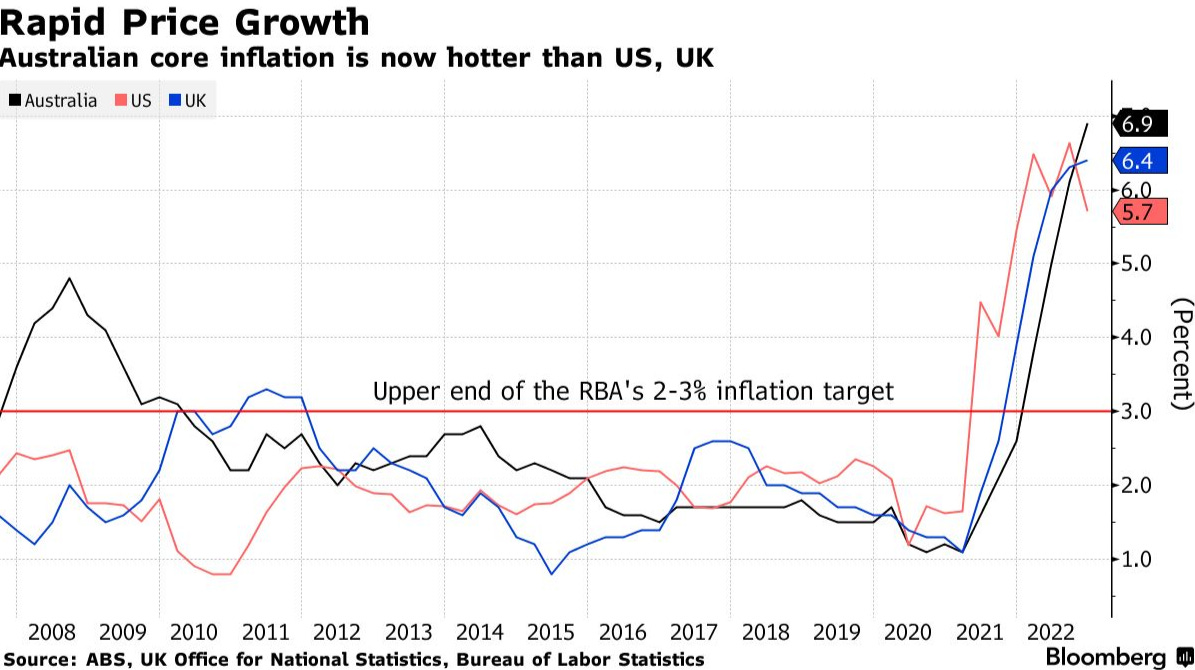
All in all, these data have prompted RBA to maintain its hawkish monetary policy guidance and upgraded its inflation and wage growth forecasts; expected the trimmed mean inflation to grow at 6.25% y/y in the year ended June, up from 5.5% previously and wages are expected to climb above 4% in June and peak at 4.25% later in 2023.
AUD is likely to face minimal downside pressure against the USD in the short to medium-term
Given a sticky hawkish stance from RBA, the AUD Is likely to be a “defensive currency” against an imminent medium-term bullish reversal USD backdrop (click here for a recap).
The current 1-month rolling performance of USD against the major currencies (including SGD & CNH) has ranked USD/AUD at the bottom of the “food chain”, slightly above USD/CAD and USD/CHF.
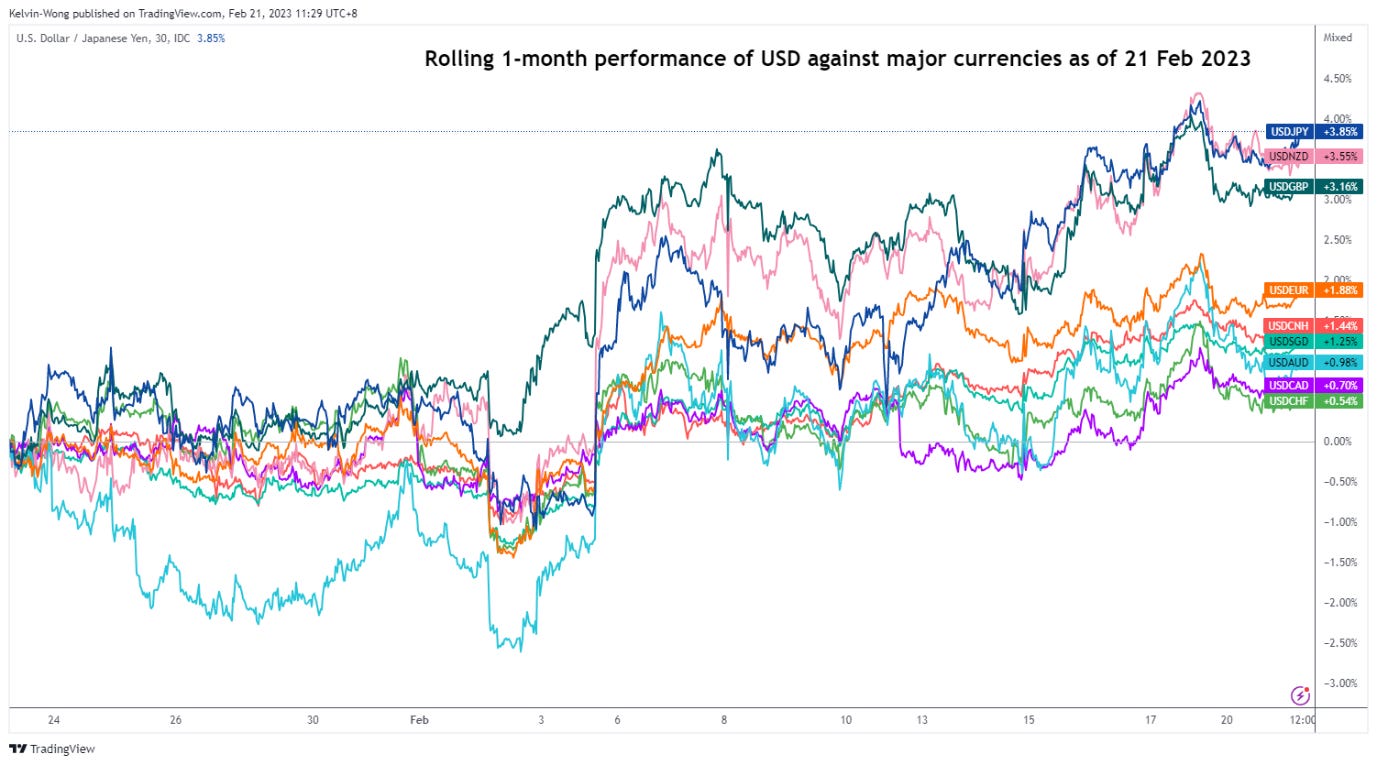
Source: TradingView as of 21 Feb 2023
Hence, some AUD crosses may offer interesting tactical set-ups in the short to medium-term time horizons.
Global Macro Charts Of The Week – curated based on integrated technical analysis (fractals, momentum & graphical)
New additions…
Invesco S&P 500 Low Volatility ETF (SPLV) – Potential bullish breakout from a 2-month range
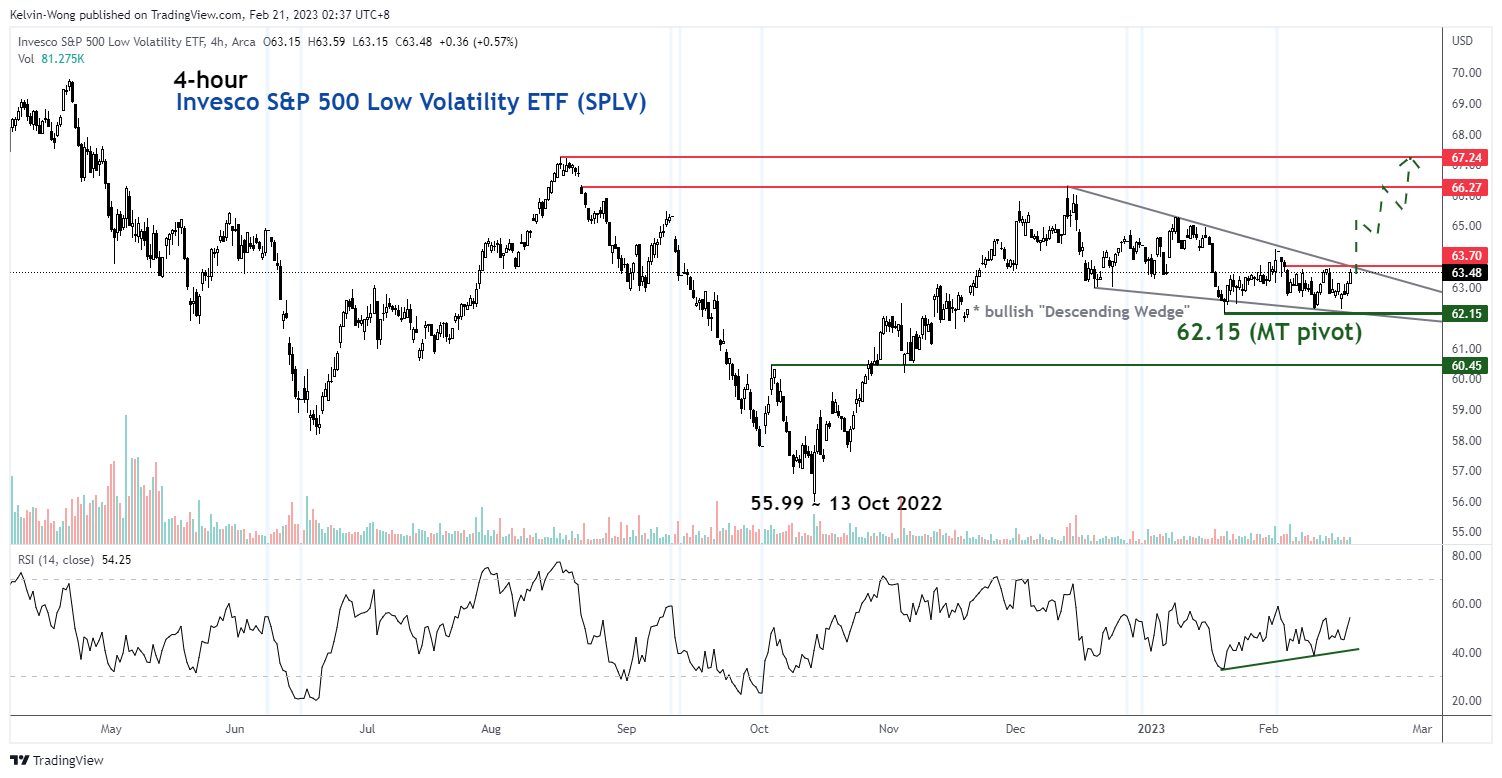
Source: TradingView as of 17 Feb 2023
The Invesco S&P 500 Low Volatility factor ETF (SPLV) has traced out a bullish “Descending Wedge” range configuration in place since its 13 December 2022 high of 66.30.
Positive momentum has resurfaced as indicated by the current observations seen in the daily RSI oscillator. Watch the 62.15 key medium-term pivotal support and a break above 63.70 (upper boundary of the “Descending Wedge”) may trigger a multi-week up move to retest the intermediate resistances of 66.30 and 67.24.
On the other hand, a breakdown with a 4-hour close below 62.15 negates the bullish tone for a further slide toward the next support at 60.45.
GBP/AUD – Short-term downtrend phase remains intact
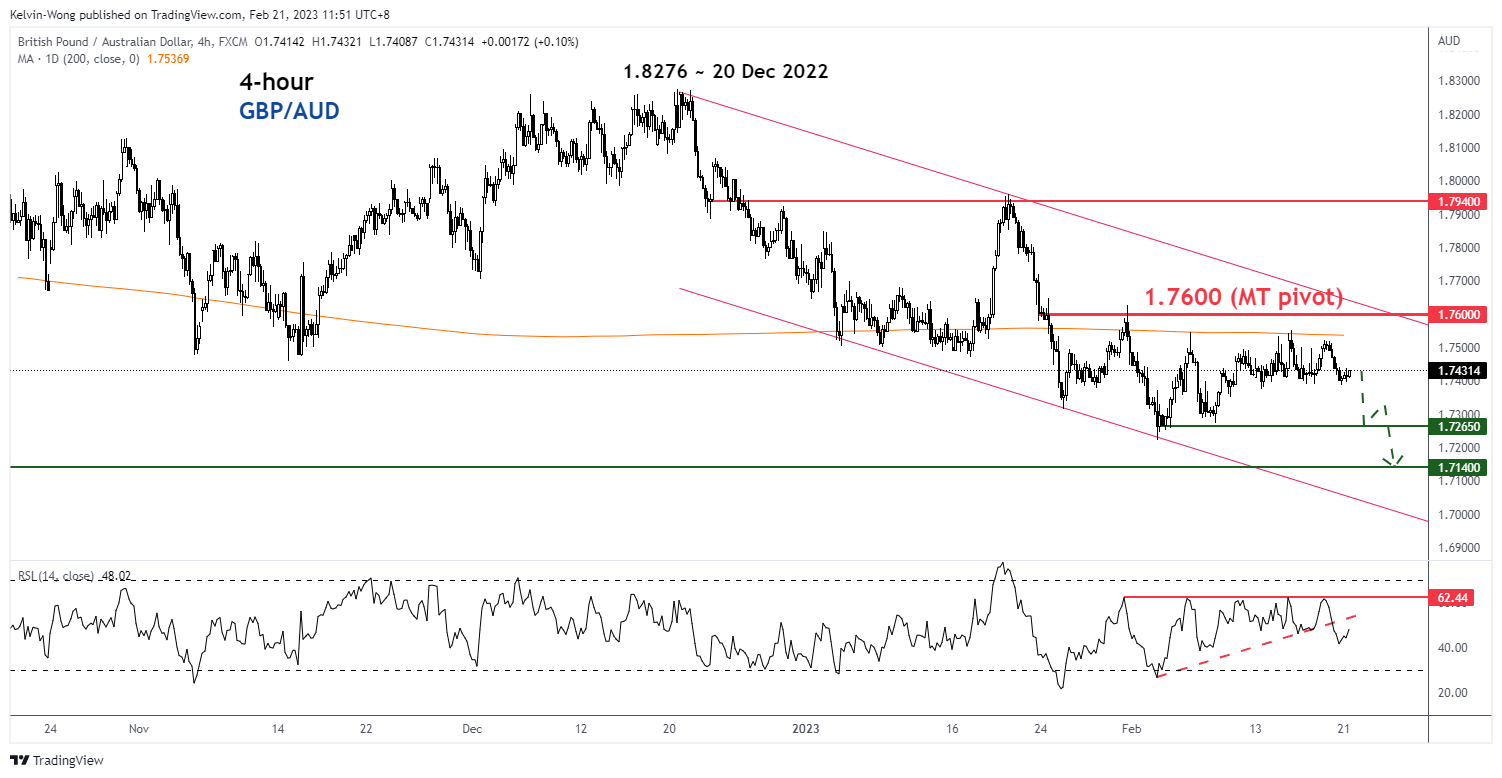
Source: TradingView as of 21 Feb 2023
The GBP/AUD cross pair has been evolving within a short-term descending channel since the 20 December 2022 high of 1.8276 and has not reached an extreme oversold condition as indicated by the 4-hour RSI oscillator.
Watch the 1.7600 key medium-term pivotal resistance for a further potential slide toward the next intermediate supports at 1.7265 and 1.7140. However, a breakout and a 4-hour close above 1.7600 invalidates the bearish scenario for a squeeze up to retest the 1.7940 resistance.
Short-term Tactical Global Macro Model Portfolio
Below is a summary table of assets from prior newsletters’ “Global Macro Charts Of The Week”
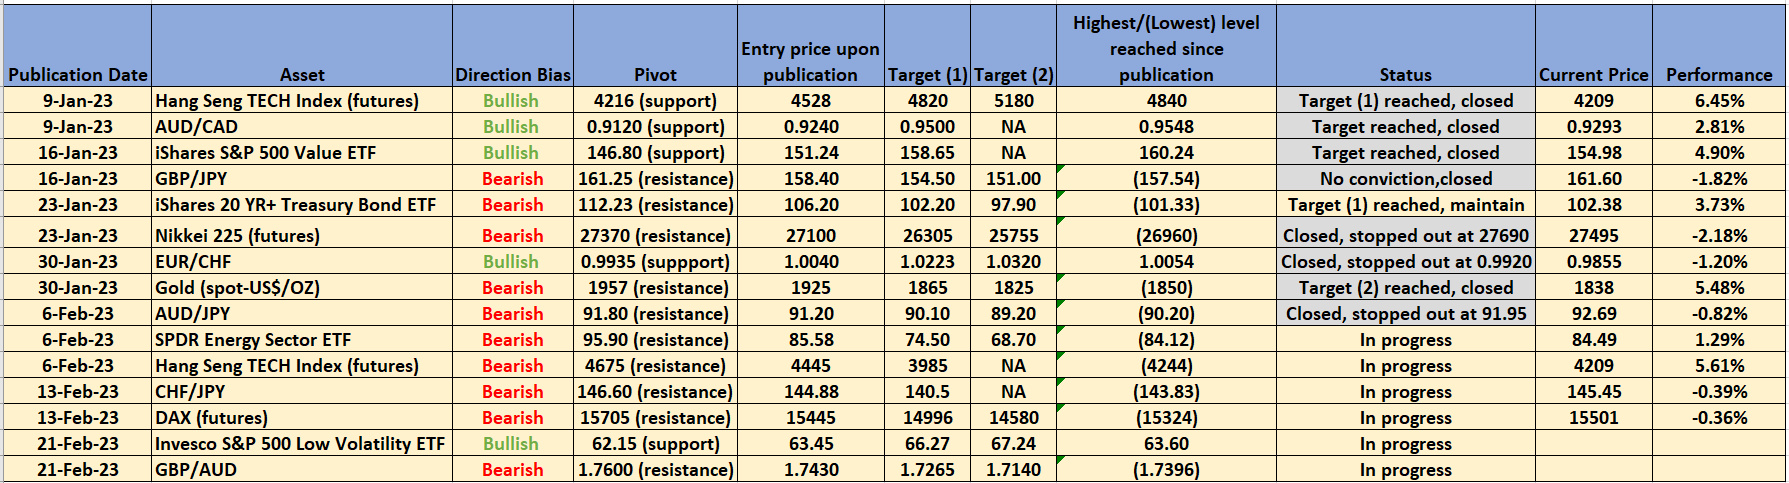
Source: TradingView as of 21 Feb 2023
Disclaimer
The content of this newsletter should not be construed as a solicitation to invest and/or trade. This is not trading/investment advice and all content is portrayed as opinion. Past performance is not indicative of future performance.
That’s all for today. I hope you enjoyed my analyses; do feel free to forward them to your friends, and colleagues. Remember to subscribe to the newsletter for the latest updates.