


Global Macro Weekly Playbook (16 Jan)
“Risk-on fantasy” continues to persist but may be reaching a tipping point soon

Recap for last week…
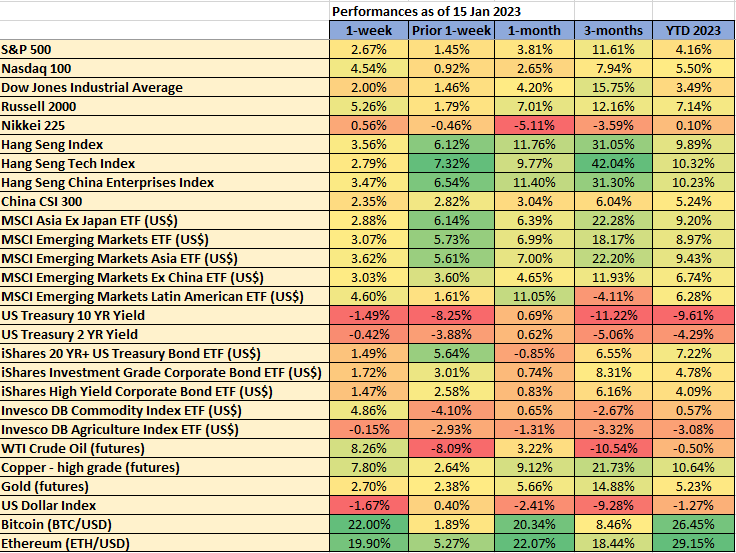
Data from TradingView & MarketWatch
The “risk-on” rally has continued to play out for the second consecutive week where positive feedback loops that were seen initially in the global major stock indices except for Japan’s Nikkei 225 have spread into the cryptocurrencies space; Bitcoin (BTC/USD) and Ethereum (ETH/USD) recorded stellar weekly gains of 22% and 19.90% respectively.
Even WTI crude has almost reversed its prior week’s loss coupled with positive weekly returns seen across the entire US fixed-income space; from US Treasuries, and high-quality corporation bonds to high-yielding corporate bonds with lower credit ratings. In addition, gold futures has continued its relentless up move in place since November 2022 and added a weekly gain of 2.78% to rally to a near 8-month high aided by a weaker US Dollar Index.
The main driver for the continued improvement in risk appetite has been a slow-down in the growth of the US inflation rate which printed at 6.5% y/y in December (in line with consensus) versus 7.1% y/y reading in November. However, data for the Atlanta Fed sticky CPI and Cleveland median CPI for the same period have come in at elevated levels; sticky CPI inched higher to 6.7% y/y from the prior month, November print of 6.6% y/y while median CPI has remained almost unchanged at 6.9% y/y.
In addition, market participants have chosen to ignore several Fed officials’ hawkish stances where they reiterated in their respective public speeches last week that interest rates were going to stay higher for longer periods and low odds of a Fed funds rate cut in 2023. On the contrary, interest rate futures and swaps have priced in a 50bps cut in the later part of 2023.
The buzz of the US Q4 earnings session has also kickstarted last Friday with the major Wall Street banks; JP Morgan, Bank of America, Wells Fargo, and Citigroup. At the opening bell, the major US benchmark stock indices gapped down with losses close to -1% after market participants digested the lackluster earnings guidance from the US banks; stockpiled more rainy funds to prepare for a possible recession, JP Morgan, Wells Fargo and Bank of America gave either disappointing or uncertain outlooks for net interest income. Interestingly, the initial losses inflicted on the US stock indices were short-lived as all of them recovered thereafter reinforced by a better-than-expected preliminary University of Michigan US consumer sentiment for January that rose to a 9-month high of 64.6 from the previous month’s finalized reading of 59.7 recorded for December.
All in all, this “risk-on fantasy” has continued to persist on the backdrop of an expected imminent Fed rate cut in 2023 coupled with a smooth China reopening and stimulative policies narrative where correlation in cross-assets (commodities, stock indices, fixed income, and cryptocurrencies has now turned highly positive. Hence, it may be leading to a tipping point for a bearish reversal across the board more easily when the exuberance hopes of a Fed rate cut have dampened.
A key trigger point for the bearish reversal on the current “risk-on fantasy” behavior is likely to come from the 2-year and 10-year US Treasury yields where both of them have inched down lower at a slower pace on a week-on-week basis. Also, the recent decline of the 10-year US Treasury yield from its 21 October 2022 high of 4.33% has drifted down to a key pivotal zone of 3.44%/3.30% with a positive momentum reading. A break above 3.78% may kickstart a multi-week rally in the US 10-year Treasury yield which in turn dampened the current jubilant risk-on appetite via the emergence of a new liquidity tightening narrative.
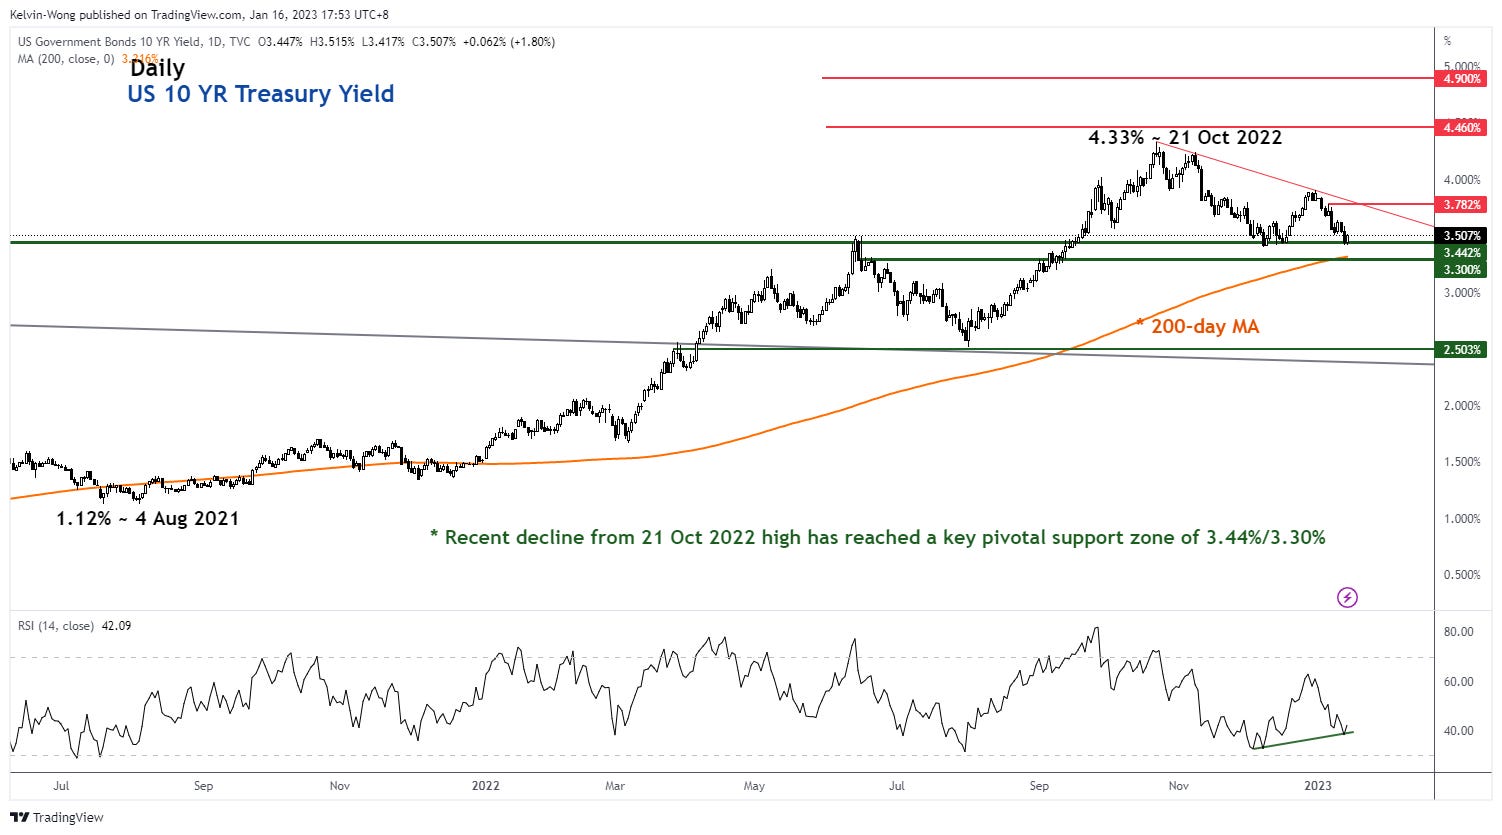
Source: TradingView as of 16 Jan 2023
Key economic data & events to watch for this week
17 January, Tuesday – China Q4 GDP, Industrial Production (Dec), Retail Sales (Dec); consensus estimates are expecting a further strain in these key economic growth indicators with Q4 2022 GDP at 1.8% y/y (its slowest growth rate since Q2 2020, down from 0.4% y/y printed in Q3 2022. Growth in industrial production is expected to slow as well to a meager rate of 0.5% y/y (its lowest level since April 2022) from 2.2% y/y in November 2022. Lastly, retail sales are estimated to contract further in December to -7.8% y/y (its worst contraction since April 2022) from November’s print of -5.9% y/y.
The weak data estimates are based on the negative spill-over effects from the previous stringent zero-Covid lockdown policies and a downturn in the property sector. Since mid-December 2022, China has started to roll back on its draconian zero-Covid measures and at the same time introduced more aggressive stimulative policies to shore up liquidity in the property sector; thus, this set of lackluster economic data flow is likely will not have a significant impact on the financial markets. On contrary, if the data turns out worse than expected, the China-related stock indices such as the Hang Seng Index, Hang Seng China Enterprise Index, and Hang Seng TECH Index may jolt higher as market participants start to price in more aggressive stimulative policies to alleviate the severe economic slowdown in China.
17 January, Tuesday – Germany ZEW Economic Sentiment Index (Jan); consensus is expecting a fourth consecutive month of improvement to -15 from -23.3 based on expert opinions’ views on the future state (in the next six months) of the German economy. The further improvement in sentiment is driven primarily by a steep fall in gas prices in Europe as the Dutch TTG Gas futures has fallen by -81% from its peak in August 2022 which in turn may soften inflationary pressures in the coming months.
Despite still being in negative territory, the improvement in the ZEW Economic Sentiment Index has moved in sync with the DAX, Germany’s bellwether stock market index. The DAX has staged a magnificent rally of 27% from its October 2022 low and ended last week with a gain of 3.26% as well as a weekly close at almost a 12-month high. Hence, if the ZEW Economic Sentiment Index turns out better than expected, the DAX will likely sustain its positive feedback loop mechanism.
17 January, Tuesday – Canada CPI (Dec); estimates are expecting the inflation rate to cool down to 6.3% y/y from 6.8% y/y (Nov) while consensus for core inflation rate remains the same at 5.8% y/y as printed in November.
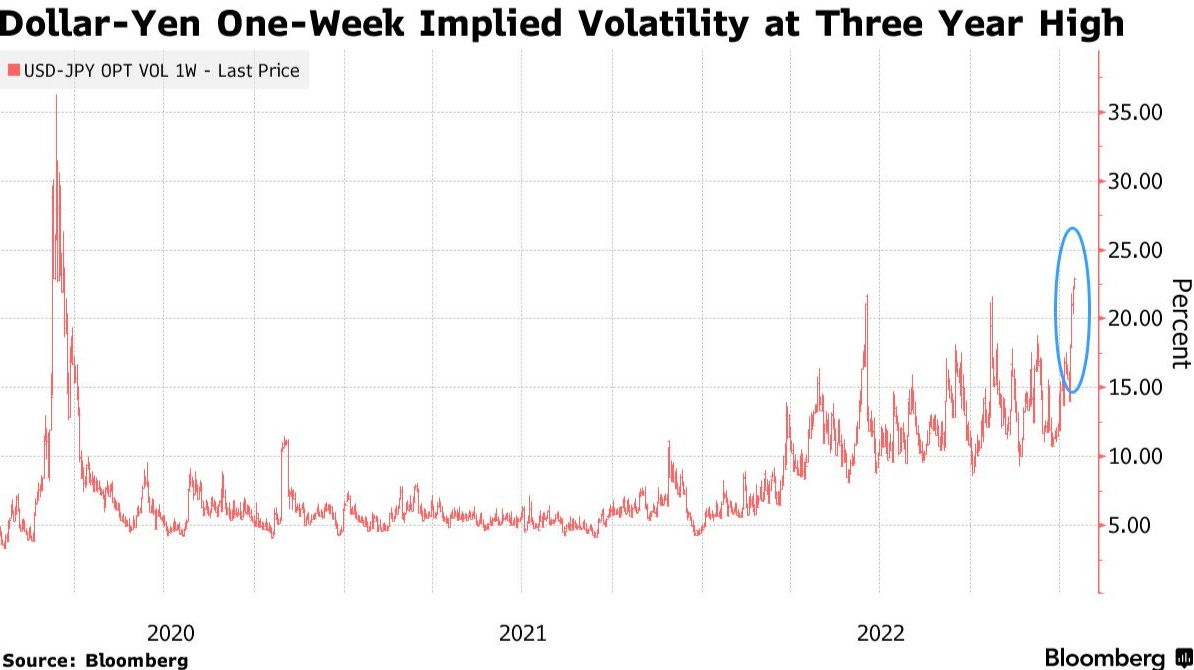
18 January, Wednesday – BOJ monetary policy decision; the drums are growing louder for BOJ to take more concrete steps to normalize its decade-plus of ultra-loose monetary policy as its marginal benefits for Japan’s economy diminish. Market participants have started to price in more hawkish guidance from BOJ after its last meeting in December where it has allowed the band of the 10-year JGB yield to fluctuate within a wider range of 0.5% on either side under its controversial yield curve control program. The JPY has strengthened and it was the best performer among the major currencies where it gained by 3.33% against the USD last week. In addition, the USD/JPY one-week implied volatility via options pricing has jumped to a three-year high at 24% which has translated to a highly volatile move in either direction for the spot USD/JPY post-BOJ meeting outcome.
Also, do keep a lookout for new quarterly economic projections released along with the monetary policy statement on the same day. Hence any uptick in inflationary outlook in the coming fiscal years and or either any hints to scrap its yield curve control program is likely to further reinforce further JPY strength and may trigger a further decline in share prices for certain Japanese firms such as exporters and car manufacturers.
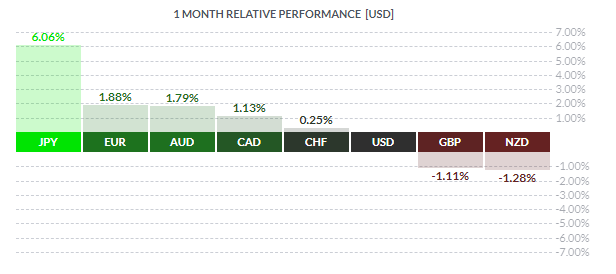
Source: finviz as of 13 Jan 2023
18 January, Wednesday – UK CPI (Dec); estimates are expecting both inflation and core inflation to remain elevated at 10.6% y/y and 6.3% y/y versus their November prints of 10.7% y/y and 6.3% y/y respectively.
18 January, Wednesday – US Retail Sales (Dec) & PPI (Dec); consumer spending, the primary driver of growth for the US economy is expected to contract further -0.8% m/m from -0.6% m/m (Nov) while estimates for the producer prices index is expected to contract to -0.1% m/m from 0.3% m/m (Nov), resulting in a slowdown of the annual producer inflation rate from 7.4% to 6.8%, the lowest reading since May 2021.
Global Macro Charts Of The Week – curated based on integrated technical analysis (fractals, momentum & graphical)
Last week’s bullish biases on Hang Seng TECH and AUD/CAD are still in progress as both continued to hold above their respective pivotal supports. Click here for a recap.
New additions…
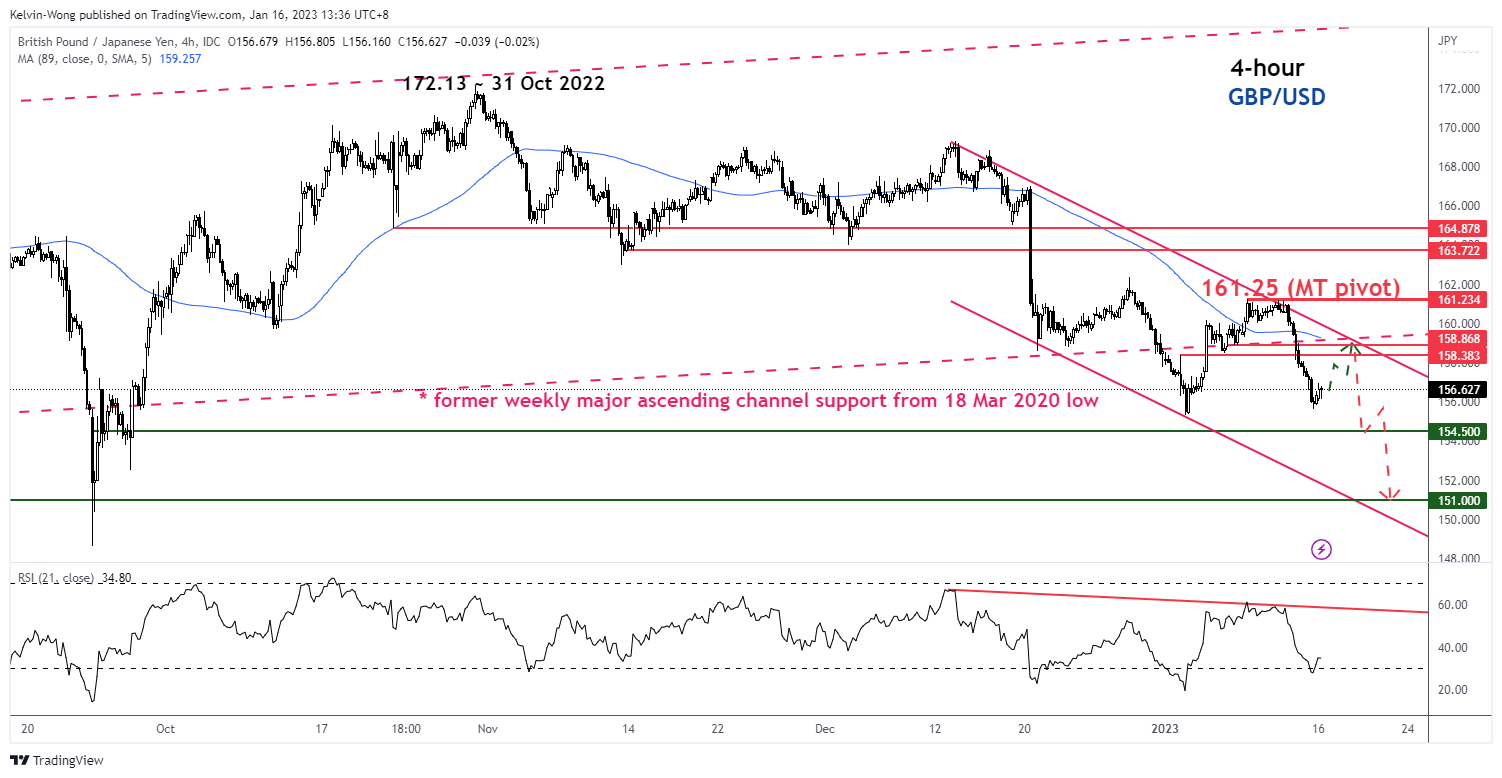
GBP/JPY – Minor bounce before potential bearish impulsive sequence resumes
Source: TradingView as of 16 Jan 2023
The GBP/JPY cross pair has been evolving within a medium-term downtrend phase since its 31 October 2022 high of 172.13 and its bearish impulsive sequence has been reinforced by its recent breakdown from its former major ascending channel support from 18 March 2020 low as depicted on its weekly chart.
Right now, the 4-hour RSI oscillator has dipped into its oversold region, indicating a higher chance of a minor bounce towards the 158.40/90 minor resistance zone before it stages another potential bearish impulsive sequence towards the next supports at 154.50 and 151.00.
On the other hand, a break and a 4-hour close above 161.25 medium-term pivotal resistance invalidates the bearish scenario for a further push-up to retest the major resistance zone at 163.70/164.88.
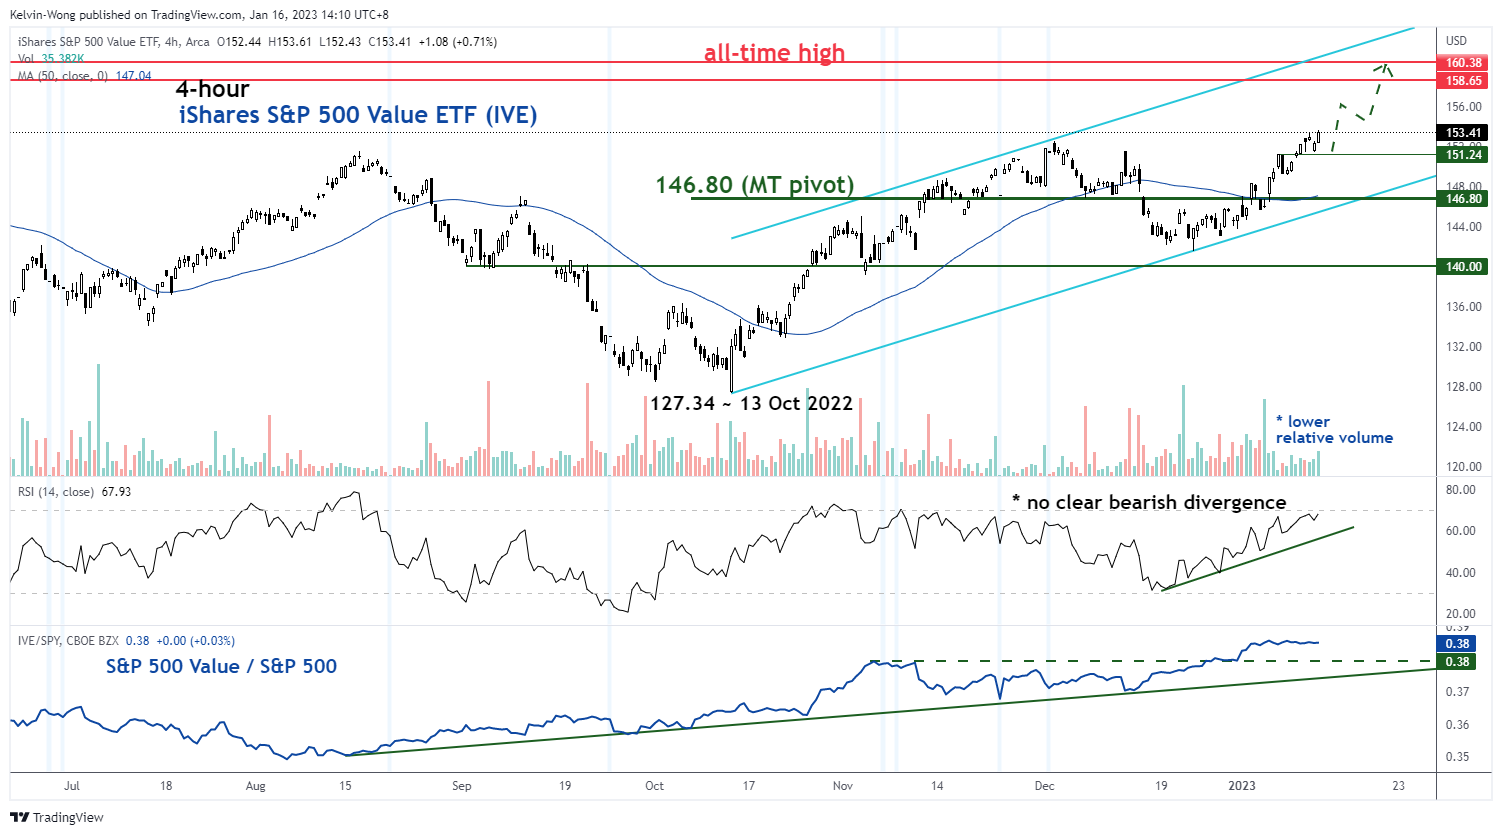
iShares S&P 500 Value ETF (IVE) – Corrective rally extends
Source: TradingView as of 16 Jan 2023
US value-based stocks have continued to outperform growth-related stocks. The medium-term corrective uptrend phase of the iShares S&P 500 Value ETF in place since 13 October 2022 remains intact as long as the 146.80 key medium-term pivotal support holds for a further potential push-up to retest its current all-time high resistance zone of 158.65/160.38.
However, a break with a 4-hour close below 146.80 kickstarts another major impulsive downside sequence for a slide toward the next support at 140.00 in the first step.
Disclaimer
The content of this newsletter should not be construed as a solicitation to invest and/or trade. This is not trading/investment advice and all content is portrayed as opinion. Past performance is not indicative of future performance.