


Q1 2023 Key Emerging Global Macro Theme Plays In 15 Charts

The major bearish force is still intact for S&P 500
Source: TradingView as of 23 Dec 2022
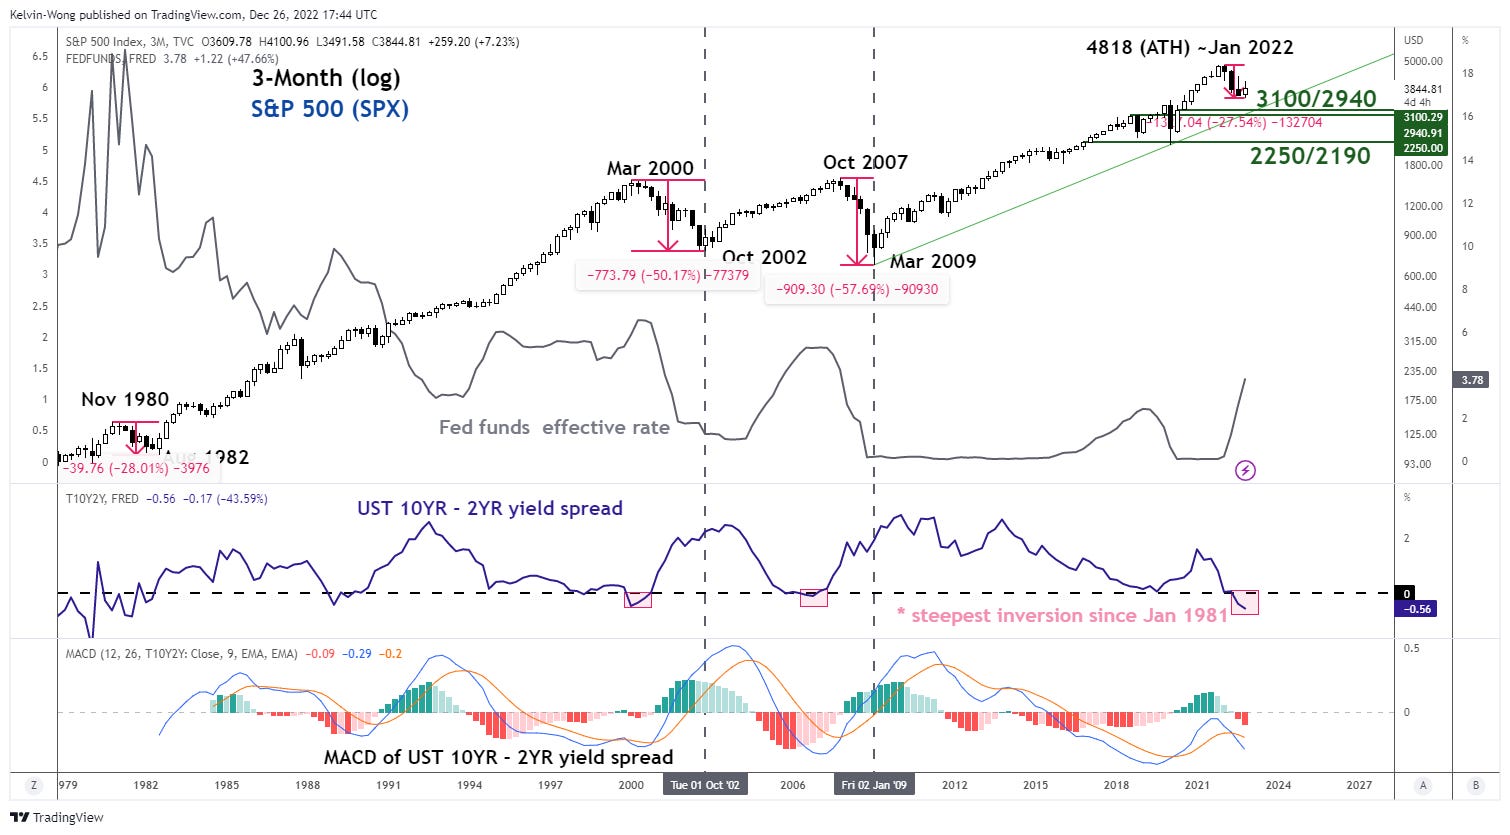
The US economy is likely to enter an “official recession status” in 2023 based on the magnitude of inversion seen in the US Treasury yield curve where a key segment; the 2-year note yield exceeded the 10-year note by 56 basis points. It’s the steepest inversion in forty years since July 1981 when the curve inverted by 58 basis points in January 1981.
The golden question is whether will there be further weakness in US equities in 2023 after the S&P 500, the widely followed bellwether index of the US stock market entered into a bear market status in 2022 where it declined by 27% from its all-time high level of 4,818 in early January 2022 to a low of 3,491 on 13 October 2022.
Momentum trend analysis on the spread of the US Treasury (10-year minus 2-year) using the moving average convergence divergence (MACD) indicator suggests that the spread still has room for further inversion in 2023.
A closer inspection of the MACD of the US Treasury curve spread (10-year minus 2-year) has highlighted two significant observations in the past where the S&P 500 only formed major bullish reversals in October 2002 and March 2009 after the MACD of the US Treasury curve spread reversed up from its zero line; a bull steepening scenario in the US Treasury yield curve where US central bank, the Fed cut its Fed funds rate aggressively that led to a higher magnitude of decline seen in the shorter end of the curve; the 2-year versus 10-year.
Hence, the current secular bearish trend of the S&P 500 may not be over yet & it is likely to see further weakness in 2023; watch these two key support zones, 3,100/2,940 and 2,250/2,190. Given that the US stock market is the leading general, the odds are high for another year of lackluster performance in global equities for 2023.
At risk of further major downside mean reversion for high beta Nasdaq Composite
Source: TradingView as of 23 Dec 2022
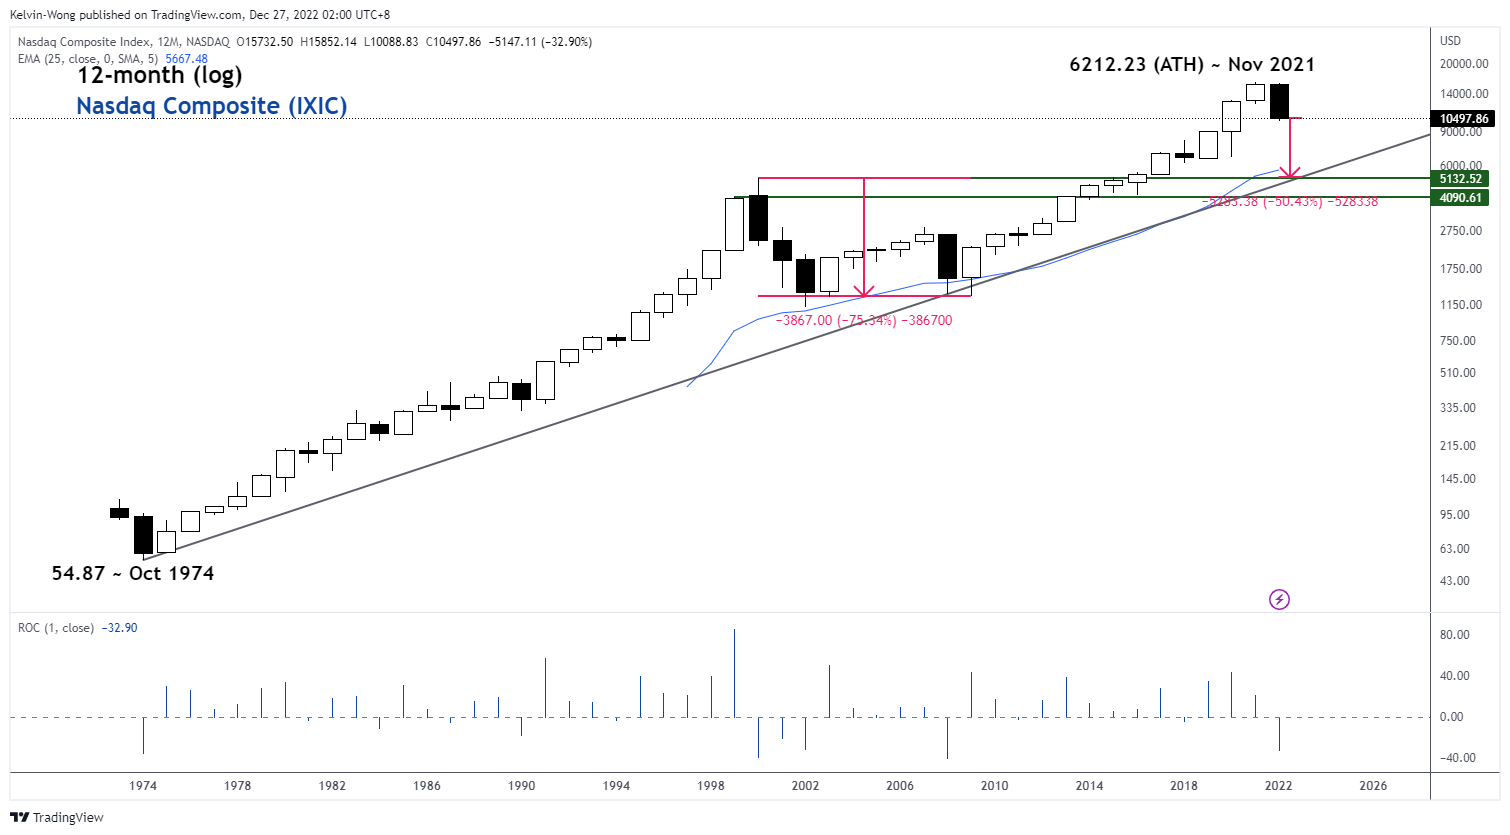
The last secular bullish trend in global equities that kickstarted on March 2009 (post-Great Financial Crisis) has been led by US technology and growth-related stocks such as the FAANNGMTs (Facebook/Meta, Apple, Amazon, Netflix, NVIDIA, Google/Alphabet, Microsoft & Tesla).
The Nasdaq Composite Index is a good barometer for such growth stocks and so far, till to date as of 23 December 2022, it is on sight to record its worst annual performance of -33% since 2008 (-41%).
From a technical analysis perspective, it faces a risk of mean reversion to retest its long-term supercycle secular bullish trendline in place since October 1974 and the 25-month exponential moving average which translates to a further potential decline of 50% from Friday’s (23 December 2022) closing level.
Apple is at risk of playing a “downside catch-up” with its mega-cap tech peers while US healthcare stocks may provide a “comforter”
Source: TradingView as of 27 Dec 2022
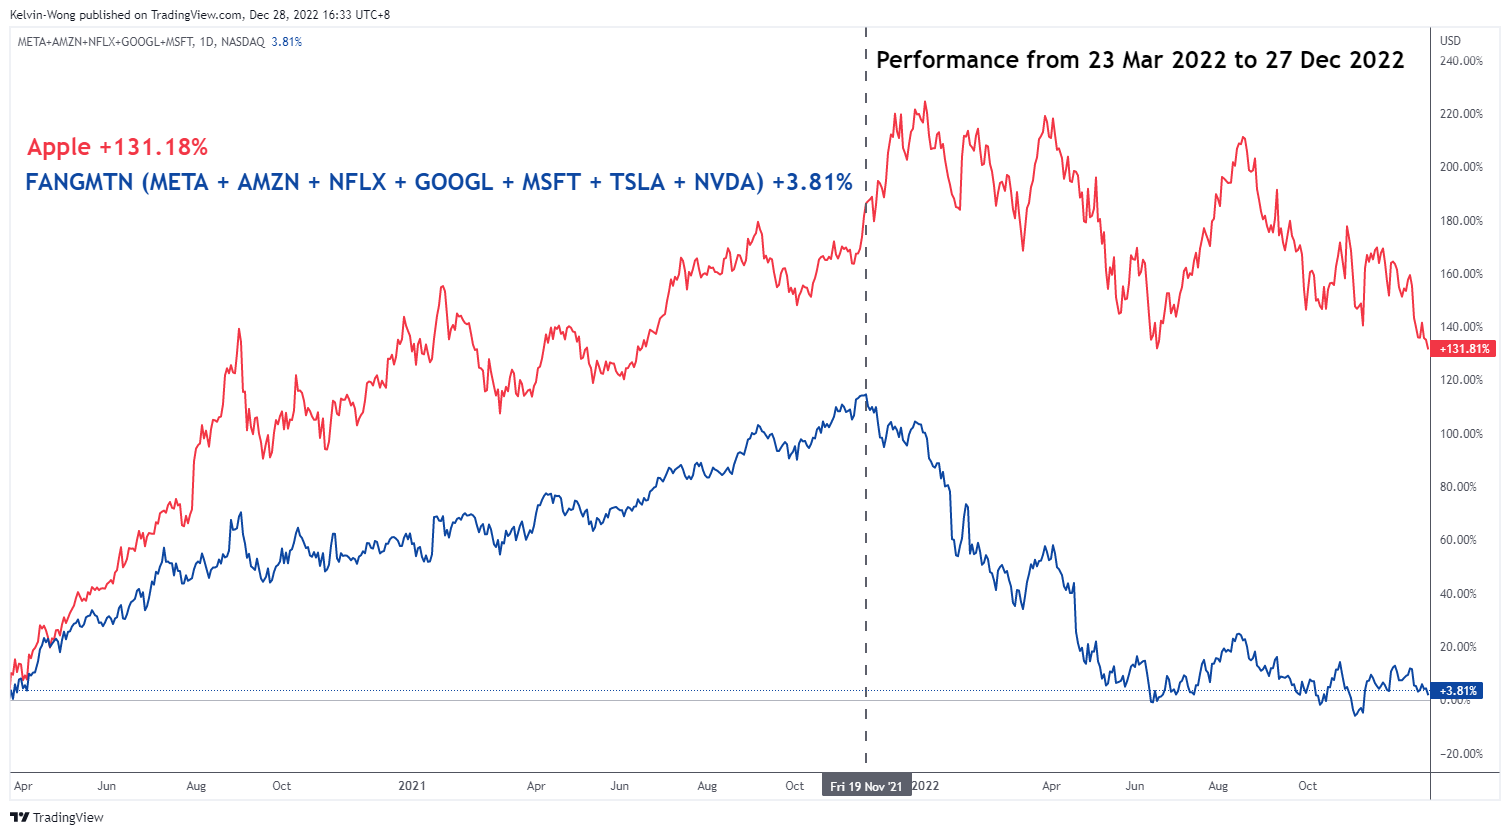
Apple has outperformed its mega-cap peers in the technology and growth segment; short-form FANGMTN acronym (Meta/Facebook, Amazon, Netflix, Google/Alphabet, Microsoft, Tesla & NVIDIA) so far with an accumulated return of +131.81% since the pandemic low of 2 March 2022. In contrast, the performance of FANGMTN has seen its return dwindle to a paltry +3.81% since its November 2021 peak.
Given that the risk of demand destruction has heightened for 2023 and the revenue streams of Apple are dependant highly on discretionary consumption, the share price of Apple may play a downside catch-up and narrow its current outperformance gap against its peers in the months ahead.
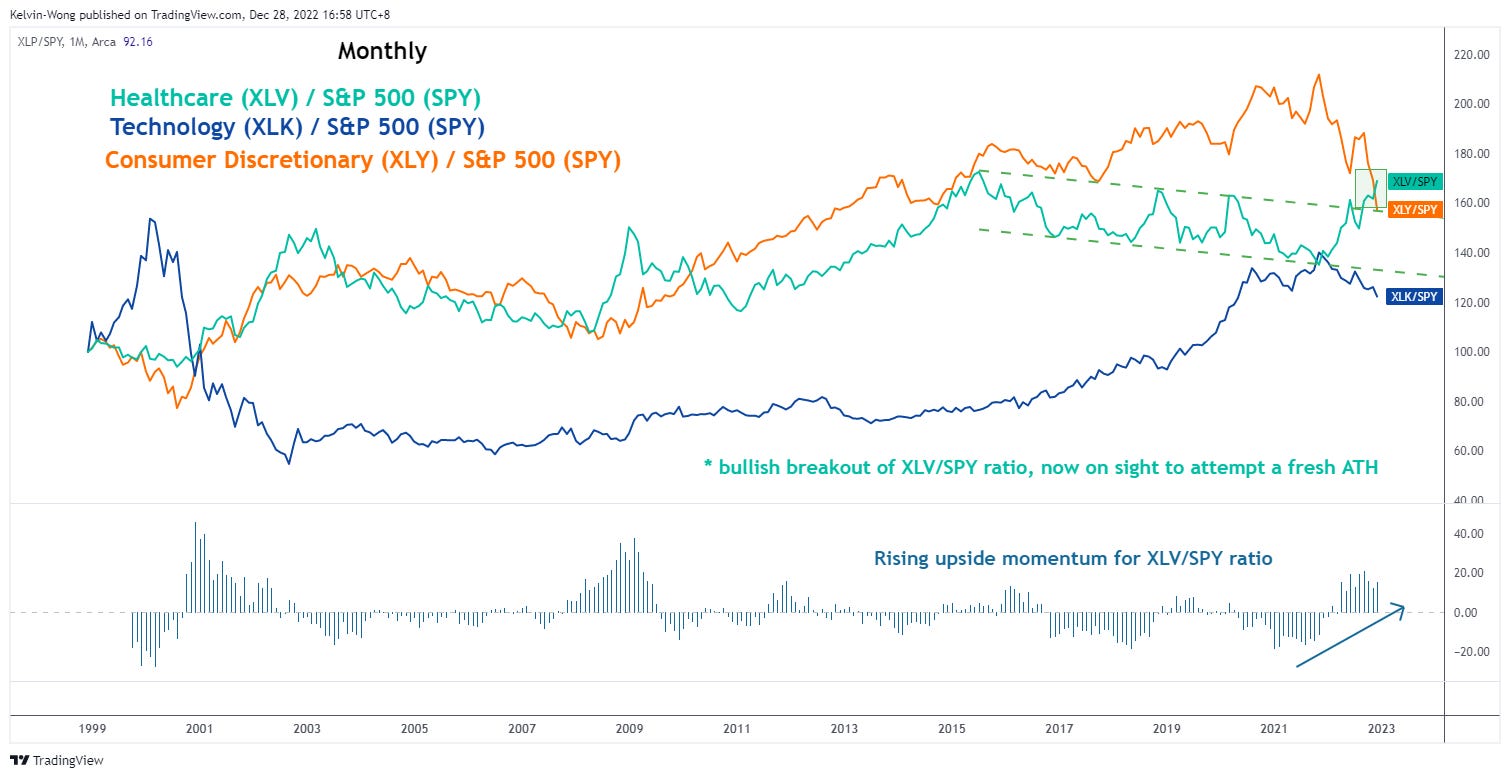
Meanwhile, US healthcare-related stocks as represented by the SPDR S&P Healthcare sector ETF (XLV) has started to show positive technical elements that advocate a potential outperformance against the S&P 500 (refer to 2nd chart)
Energy stocks may start to lose their bullish mojo in 2023
Source: TradingView as of 23 Dec 2022
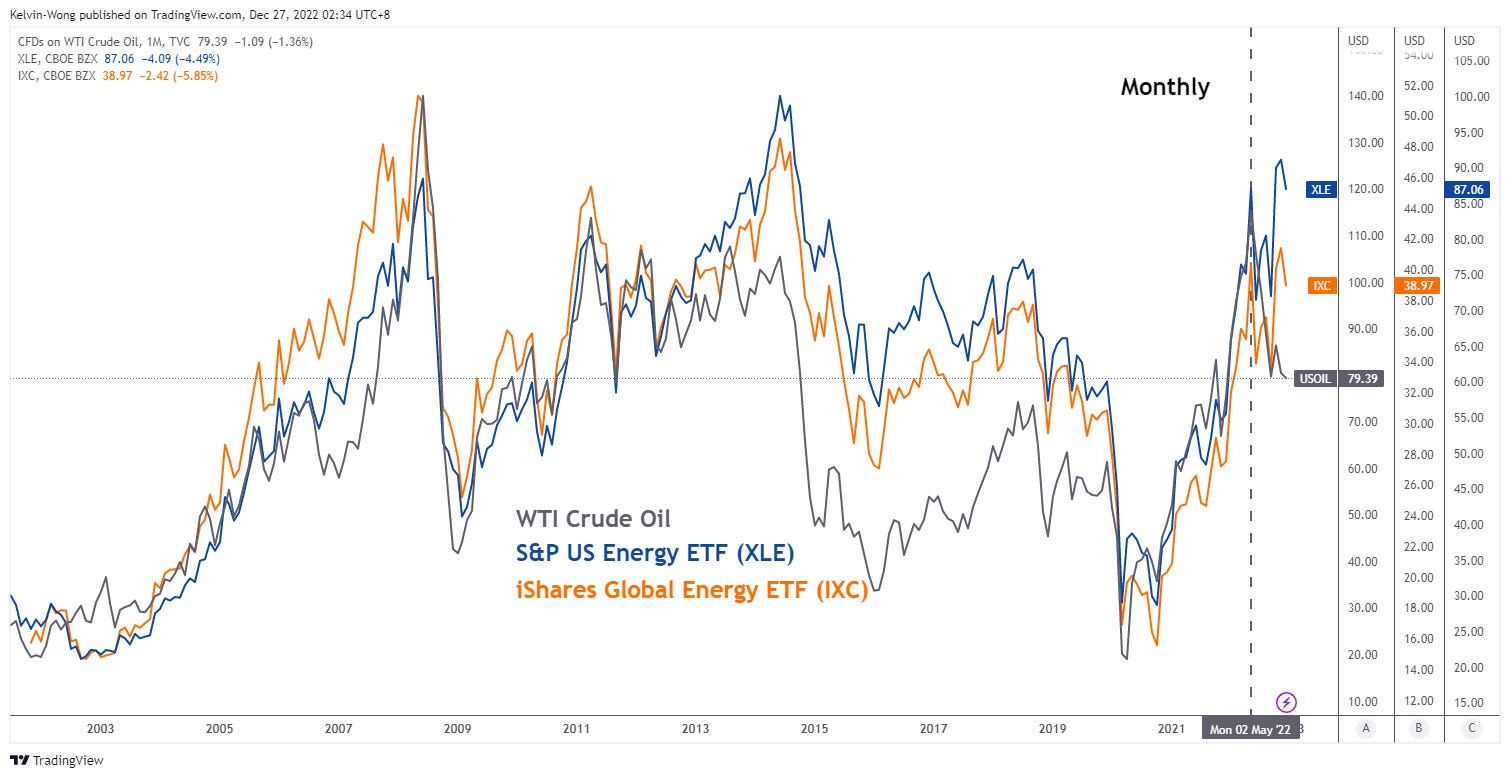
The brightest spot in the global equities space for 2022 is to be bullish on energy-related stocks. Year to date as of 23 December, US energy stocks as represented by the SPDR S&P Energy ETF has recorded a magnificent gain of 32% preceded by an annual return of 18% seen in the previous year of 2022, outperforming the benchmark S&P 500 by a wide margin with a year-to-date loss of 19%.
A similar stellar performance can also be seen on a global scale where the iShares Global Energy ETF has notched a gain of 42% year-to-date in 2022. These major bullish impulsive sequences seen in energy stocks in the past two years have been triggered by rapidly rising oil prices.
Going forward, oil prices may find it hard to repeat such a positive feat in 2023 where the benchmark WTI crude has tumbled by 39% from its 52-week high of US$129.42 per barrel on the onset of the Russian invasion in Ukraine and based on last Friday, 23 December closing level of US$78.22 per barrel, it is almost unchanged for the entire year of 2022.
The primary reason for the current softer tone in oil prices has been triggered by a hawkish monetary policy embarked on by the Fed which has seemed to maintain its tight “liquidity noose” stance with low odds of a rate cut in 2023 based on its latest guidance which in turn can lead to a higher propensity of demand destruction.
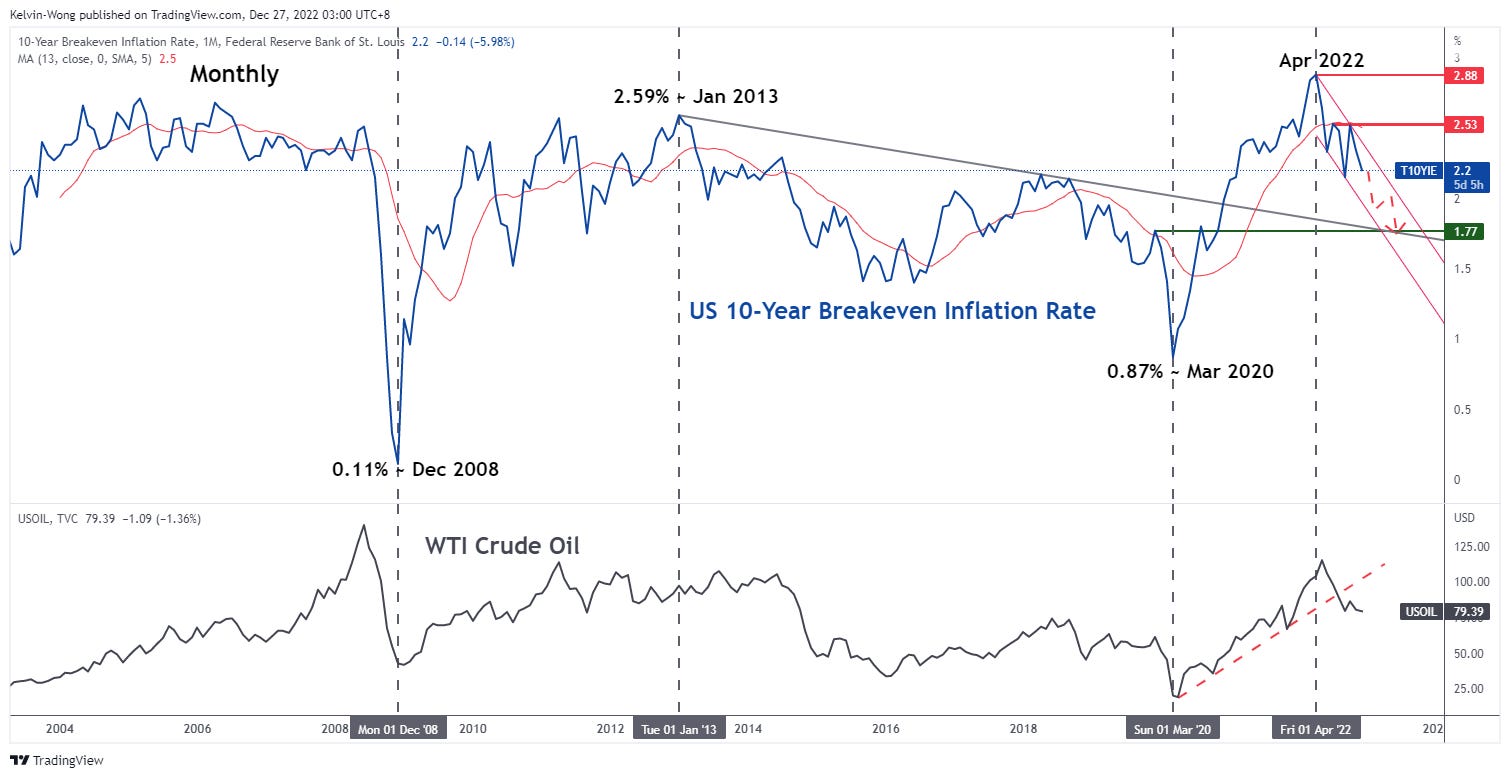
These observations can be inferred from market-based transacted financial products on future inflation expectations derived from the breakeven inflation rates; in a nutshell, using a nominal risk-free rate like the annualized yield on a US Treasury note minus the annualized yield of a TIPS (US Treasury inflation-protected security), a proxy for the real yield/real rate of similar tenure.
As seen from the second chart, the major swing highs and lows of the US 10-year breakeven inflation rate (a gauge on where inflation in the US is expected to be in 10 years ahead on an annualized basis) have led the major peaks and troughs of WTI crude oil. The recent major swing high of the 10-year breakeven inflation rate occurred at 2.88% in April 2022, one month ahead of the major peak of WTI crude oil seen in May 2022 before it staged the 39% decline.
From an integrated technical analysis perspective, the 10-year breakeven inflation rate may be in the midst of a major bearish impulsive sequence as long as 2.53% long-term pivotal resistance is not surpassed. A further decline toward the next major support of 1.77% cannot be ruled out which in turn may trigger a further negative feedback loop in oil prices. Hence, after two years of spectacular positive performances seen in global energy stocks may not be able to repeat such a feat in 2023.
Bonds may continue to bleed again
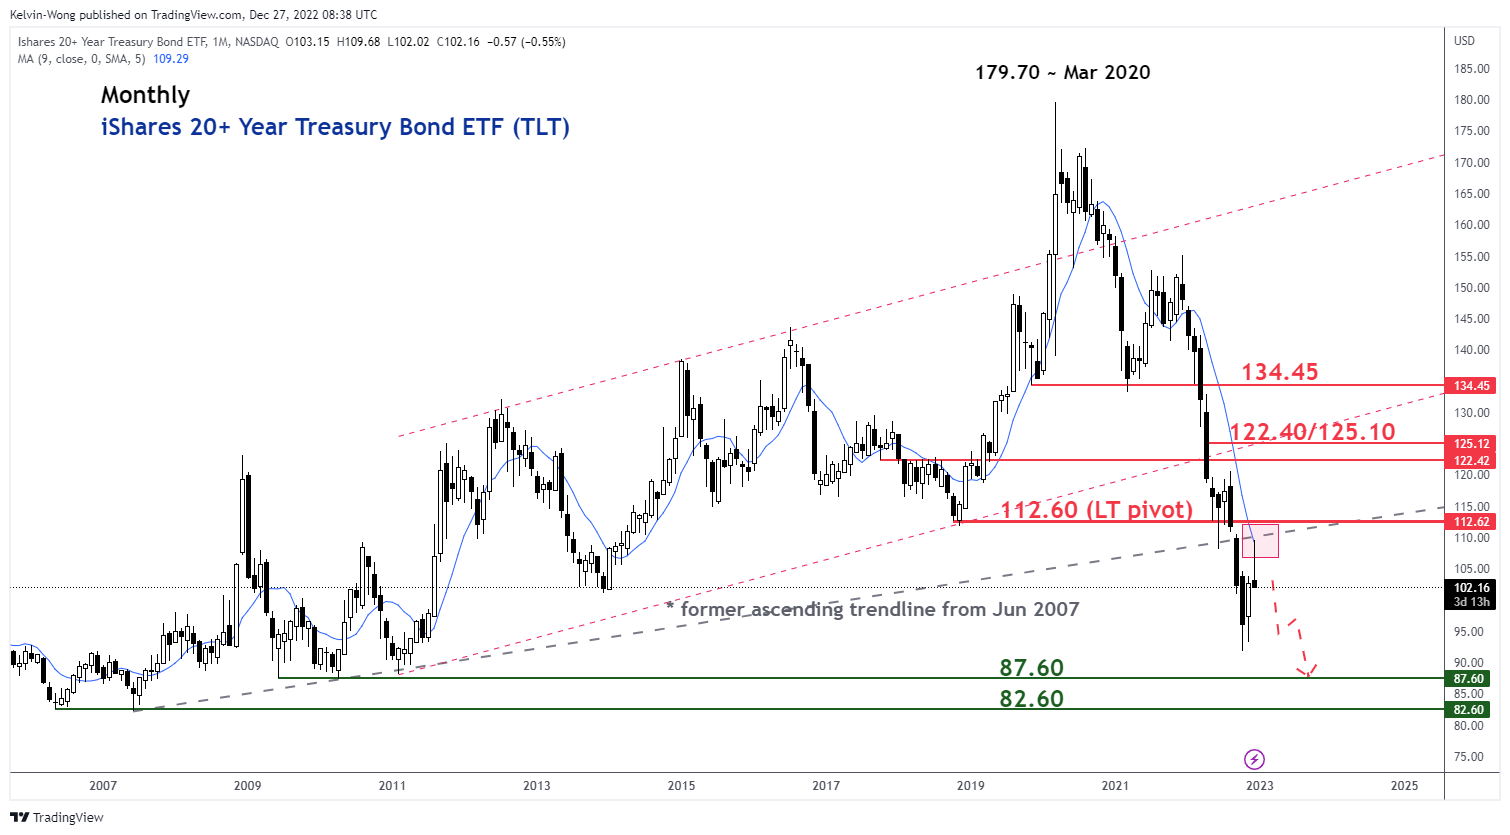
Source: TradingView as of 23 Dec 2022
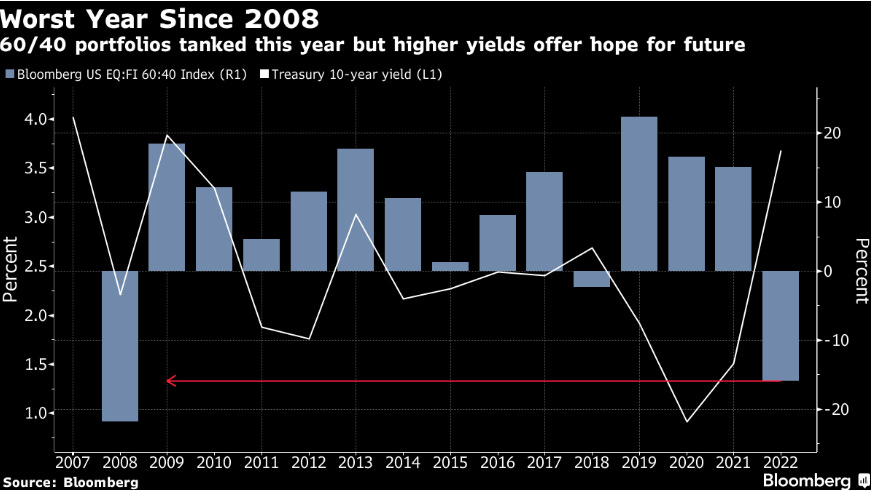
There is nowhere to hide for passive investors this year as the traditional mix of 60/40 strategic allocation in a basket of equities and higher credit-rated sovereign/corporate bonds and (60% weightage in equities & 40% in bonds) have failed to deliver the usual “textbook” diversification benefits as the price actions of equities and bonds have sold off in tandem in 2022 due to a quicker pace of liquidity tightening led by the Fed after a decade of excessive quantitative easing and loose monetary policy. Based on a Bloomberg 60/40 allocation model of equities and fixed-income instruments, the model has recorded its worst annual performance in 14 years with a loss of 16% so far in 2022.
Even though, the aforementioned potential slowdown in future inflationary expectations that are caused by the looming demand destruction from the current pace of monetary policy tightening from the Fed which in turn may bring forward the start of a new interest rate easing cycle to counter the negative economic effects from demand destruction. A higher propensity of a first Fed funds rate cut that happens sooner is likely to see an uplift in bonds’ returns as prices of bonds and their corresponding yields move in the opposite direction.
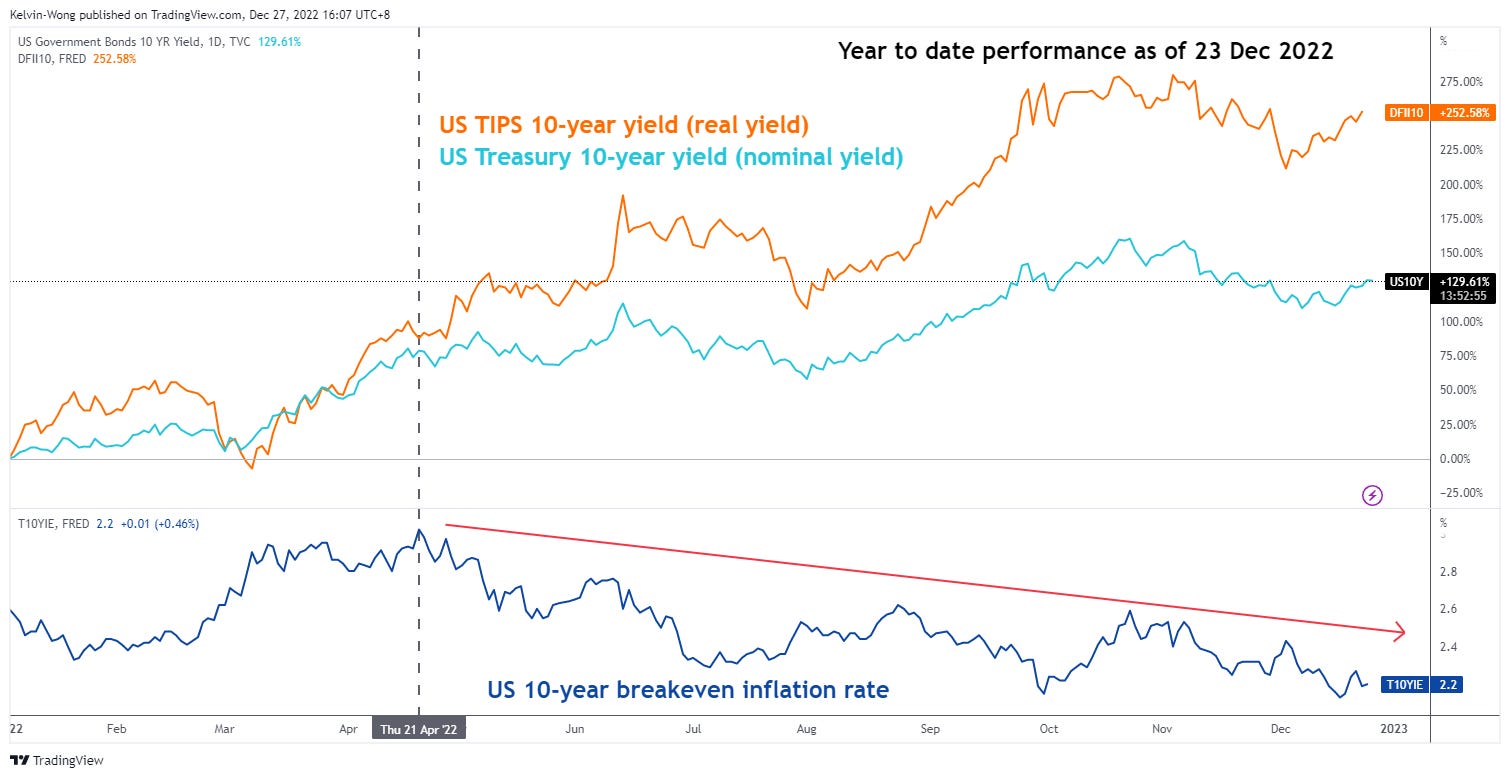
On the contrary, market-based transacted prices seem to be painting a different picture as the recent slide in the US 10-year breakeven inflation rate (a gauge of future inflation) since April 2022 has been triggered by a higher rise in magnitude seen in the US TIPS 10-year yield (a proxy for the US Treasury 10-year real yield) over the rise of the nominal 10-year yield of the US Treasury note (refer to 2nd chart).
Hence, bond prices may face downside pressure again in Q1 2023 after a recent relief rally (refer to 3rd chart).
A stronger JPY is expected & headwind for long carry trades but a potential silver lining for Japanese banks

Source: TradingView as of 28 Dec 2022
The Japanese central bank, BOJ has thrown in the towel finally after it went against the tide of global monetary policy tightening stances adopted by other developed nations’ central banks in 2022.
On 20 December, BOJ made a significant adjustment to the controlled bandwidth of its yield curve control (YCC) policy; another form of “creative” quantitative easing program that was introduced in September 2016. The latest YCC policy adjustment has now allowed the 10-year JGB bond yield to move 50 basis points on either side of the 0% target, wider than the previous 25 basis point band. This “step-up” tweak is likely to be a precursor to an interest rate hike in 2023 by the BOJ as it normalized its decade-long ultra-loose monetary policy in Japan.
Given that prices of market-based transacted financial instruments are determined by a significant portion of greed and fear (behavioural finance), hence such a small policy adjustment is likely to trigger a butterfly effect in the global financial markets. Also, bearing in mind that Japanese corporations (financial institutions & non-financial institutions) are one of the highest net exporters of capital on a global scale as they seek to invest overseas to get a better return, and such flows of funds may start to flow back to Japan as the domestic monetary policy starts to normalize.
Significant ramifications can be expected in the foreign exchange market via a potential surge in JPY strength. The USD/JPY, one of my key macro themes plays for 2022 has rallied as expected and hit the predefined major resistance zone of 147.60/149.30; it printed a 32-year high of 151.95 on 21 October 2022. Right now, the USD/JPY faces the risk of a significant multi-month downside mean reversion towards the first major support zone of 124.15/114.50 as long as 159.30 key long-term pivotal resistance is not surpassed to the upside (refer to 1st chart).
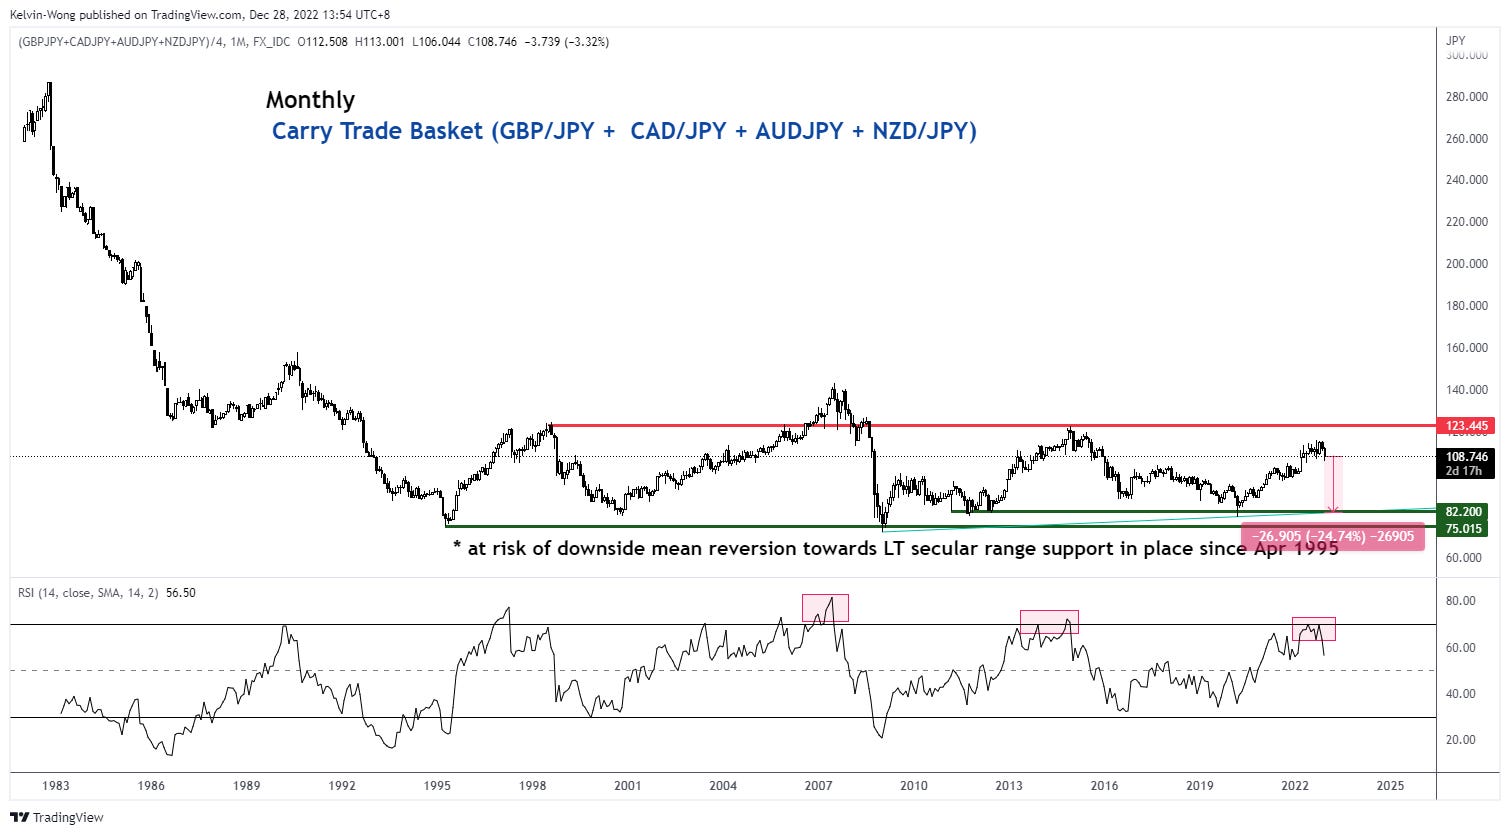
Another FX play to watch out for will be the potential unwind in long bias carry trade that involves the JPY funding leg (the short side of the trade) as illustrated by a basket of major carry trade pairs; GBP/JPY, CAD/JPY, AUD/JPY, and NZD/JPY.
The technical analysis chart of the carry trade basket has indicated a risk of a 24% decline to retest its long-term secular range support in place since April 1995 (refer to 2nd chart).
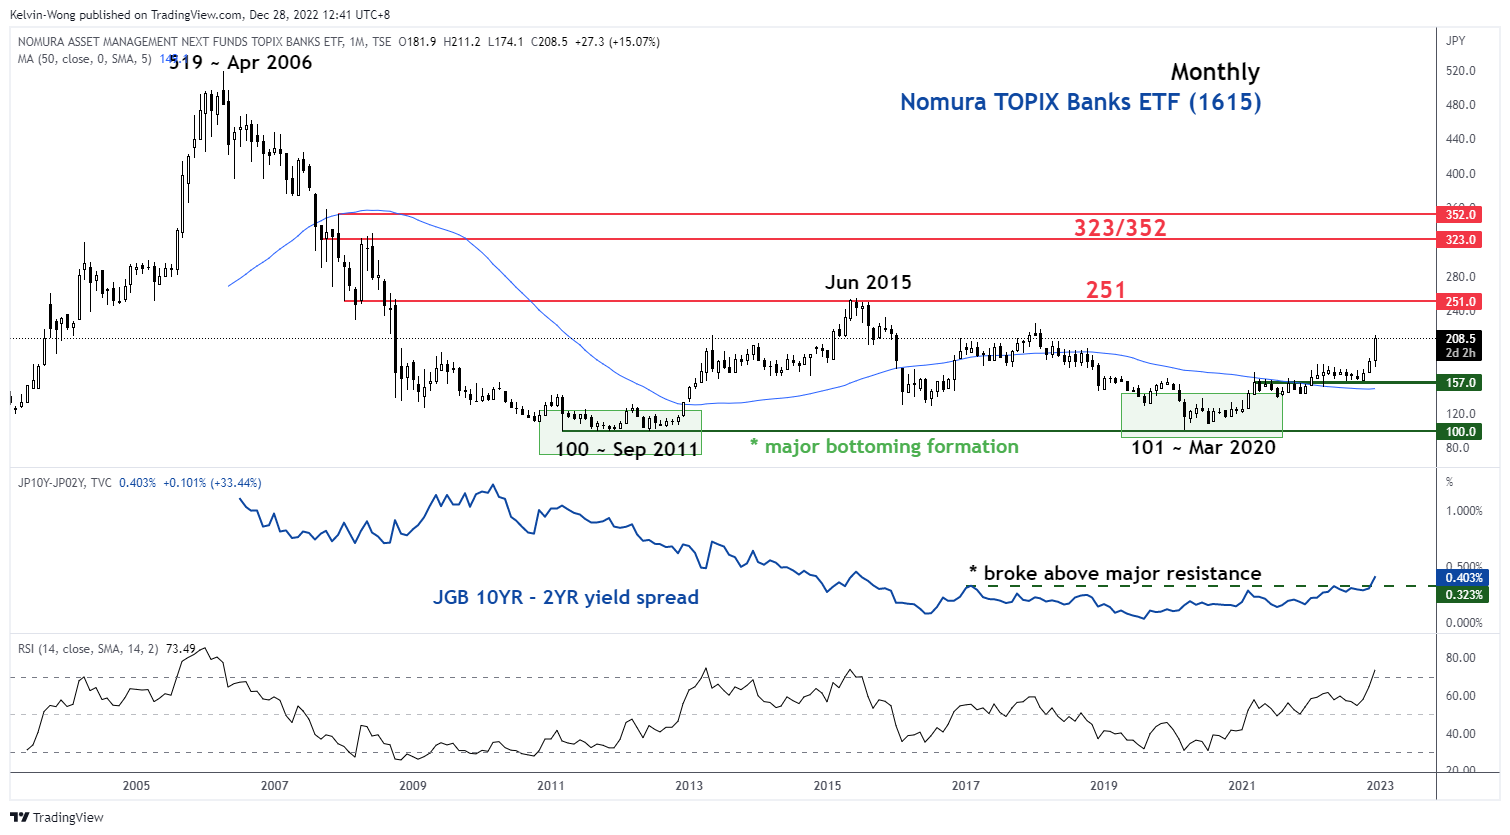
A silver lining from this fiasco is the potential outperformance of Japanese banks supported by a rising spread of the 10-year JGB yield over its 2-year. The Nomura TOPIX Banks ETF has evolved into a major bottoming formation since September 2011 and a clear breakout above 251 resistance may trigger a major bullish impulsive sequence towards 323/352 (refer to 3rd chart).
Gold may start to sparkle (finally)
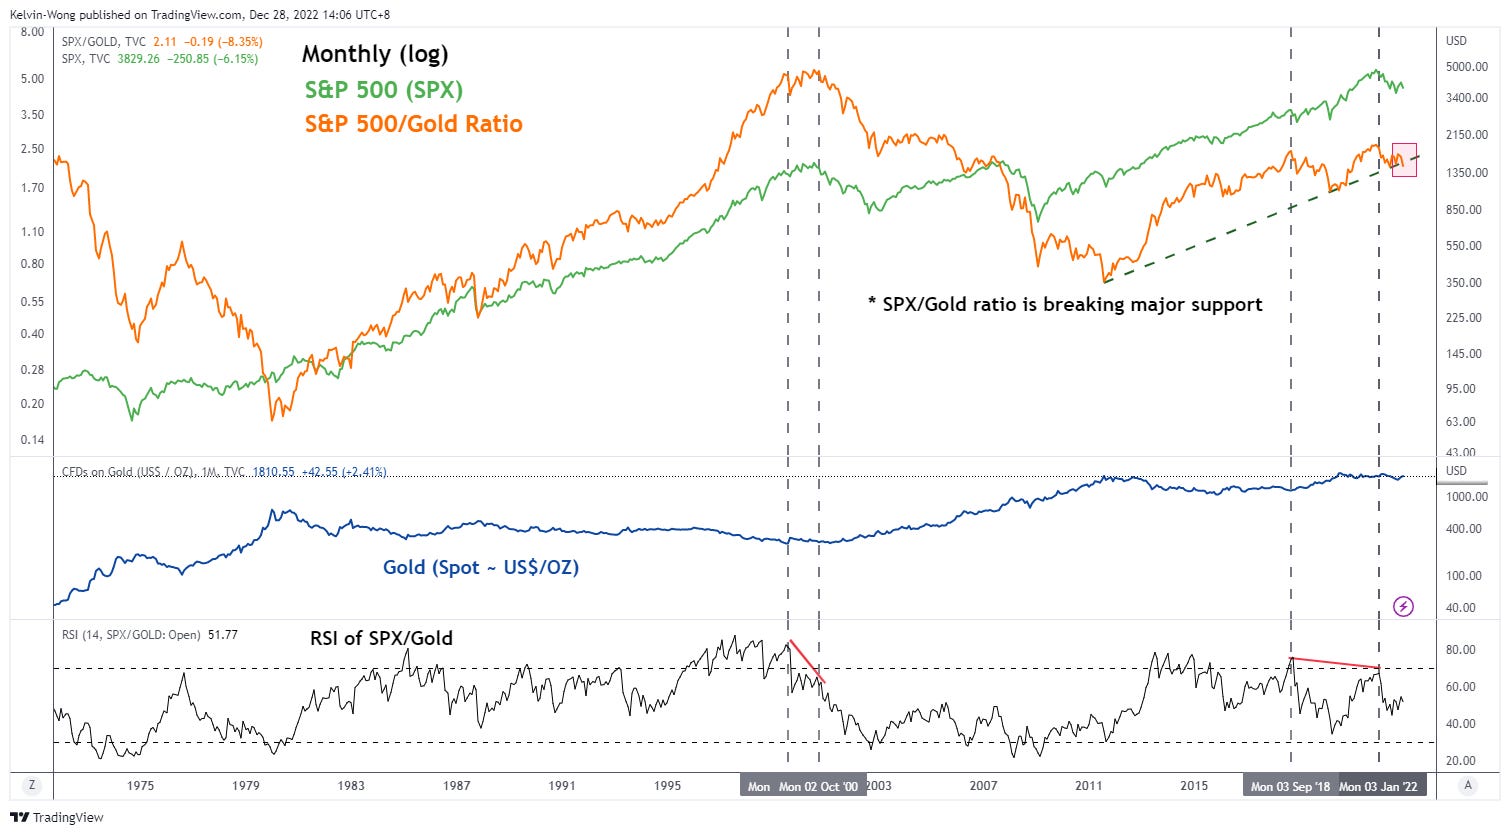
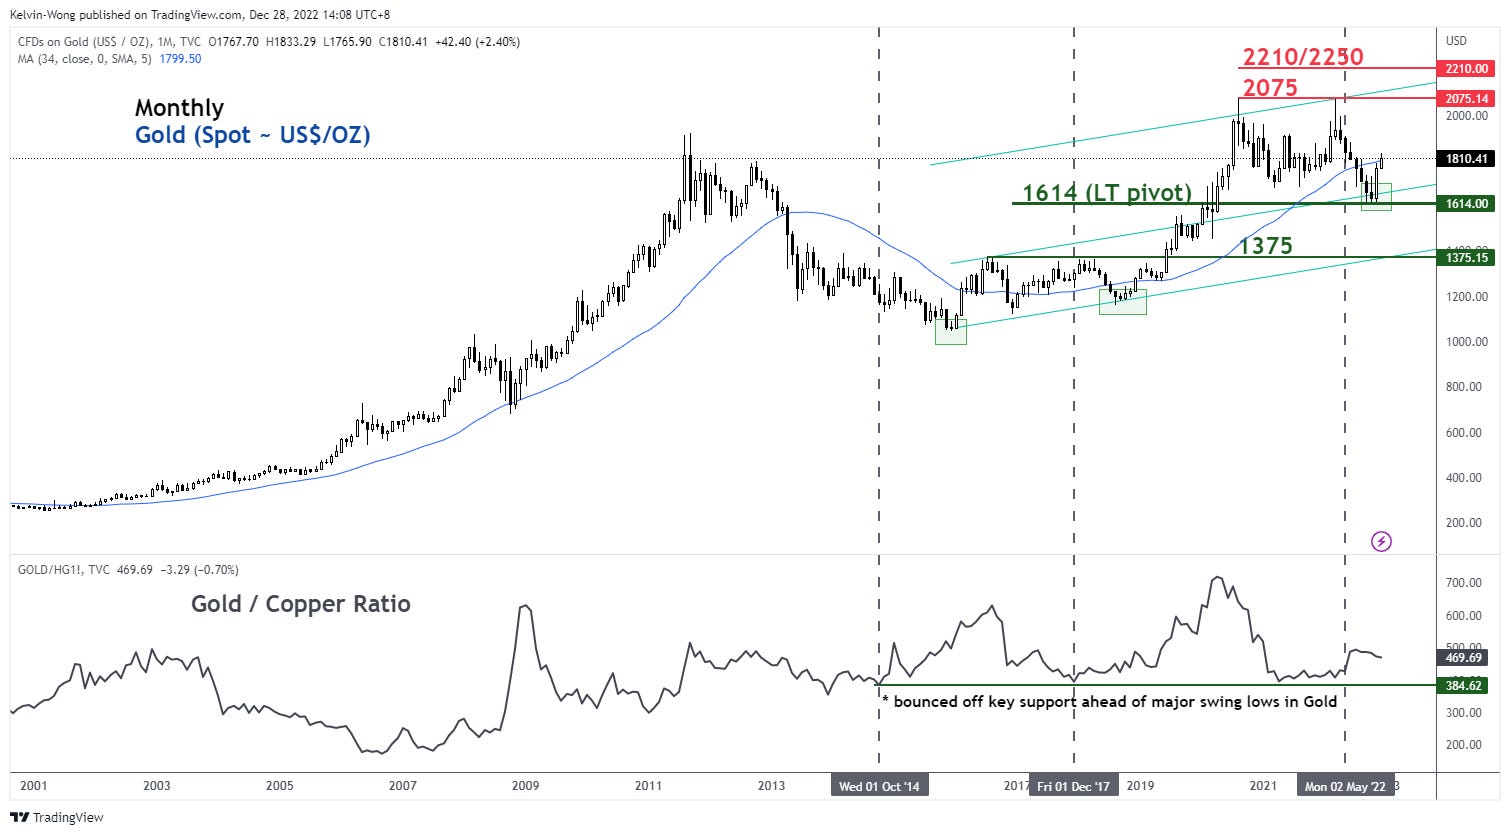
Source: TradingView as of 28 Dec 2022
Based on the first two technical analysis charts, the ratio of the S&P 500 to Gold has indicated a further momentum deterioration at this juncture and such observation has preceded the previous secular peak of the S&P 500 that formed on August 2000. In addition, the long-term secular downtrend phase of the ratio of the S&P 500 to Gold that occurred thereafter from August 2000 to July 2011 also saw a similar degree of uptrend phase in Gold during the same period.
Next, the ratio of Gold to Copper has managed to stage a bounce from key support in recent months and previous bounces that occurred in October 2014 and December 2017 led to the last major uptrend phase of December 2015 to August 2020.
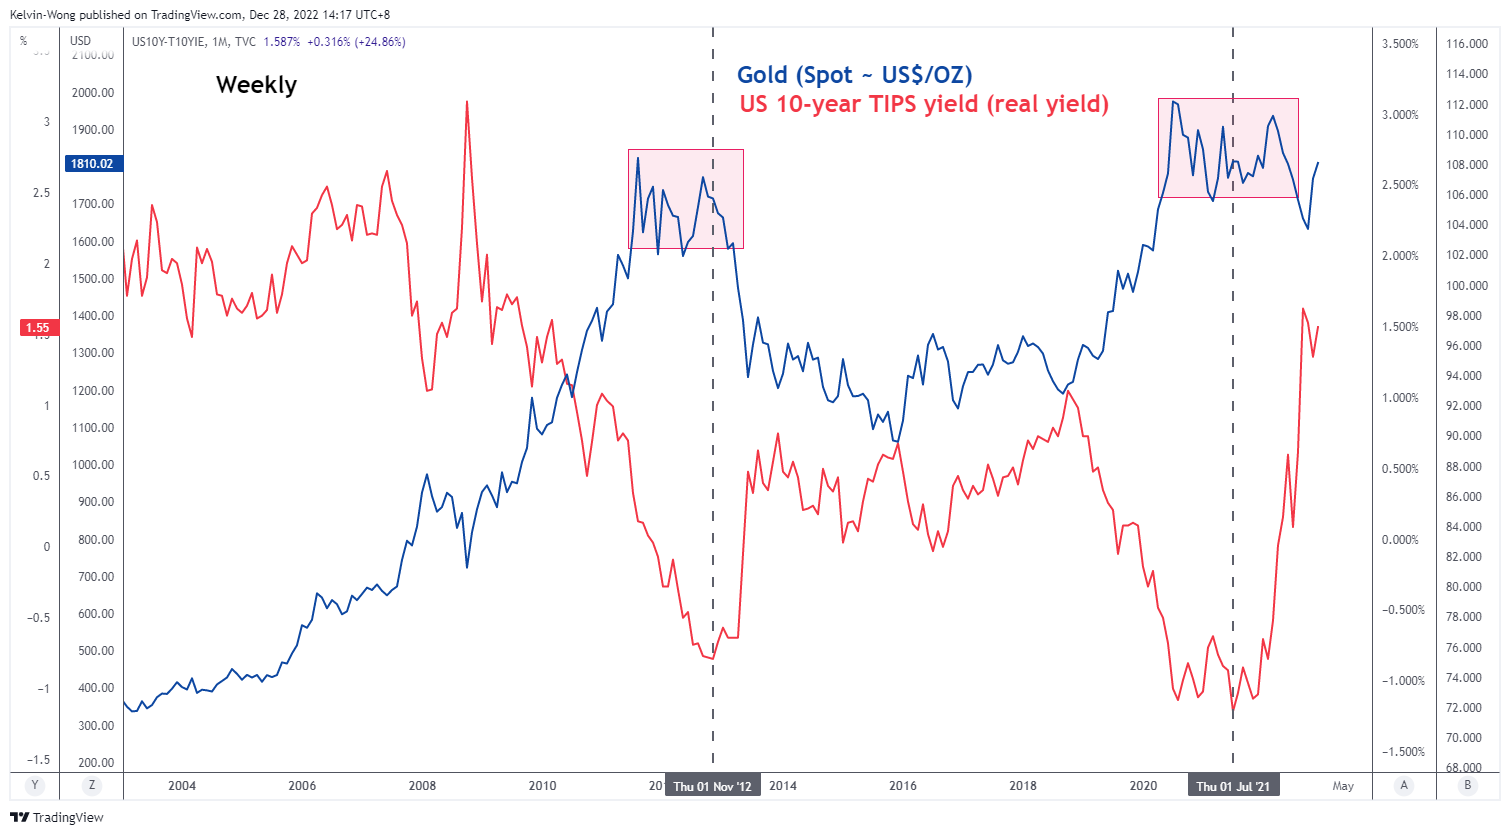
Hence, Gold may start to undergo a potential fresh major uptrend phase at this juncture but the caveat that will prevent such a tailwind is the 10-year US Treasury note real yield that has been on the rise again since last week so far (refer to the 3rd chart).
Singapore property stocks may face the force of gravity
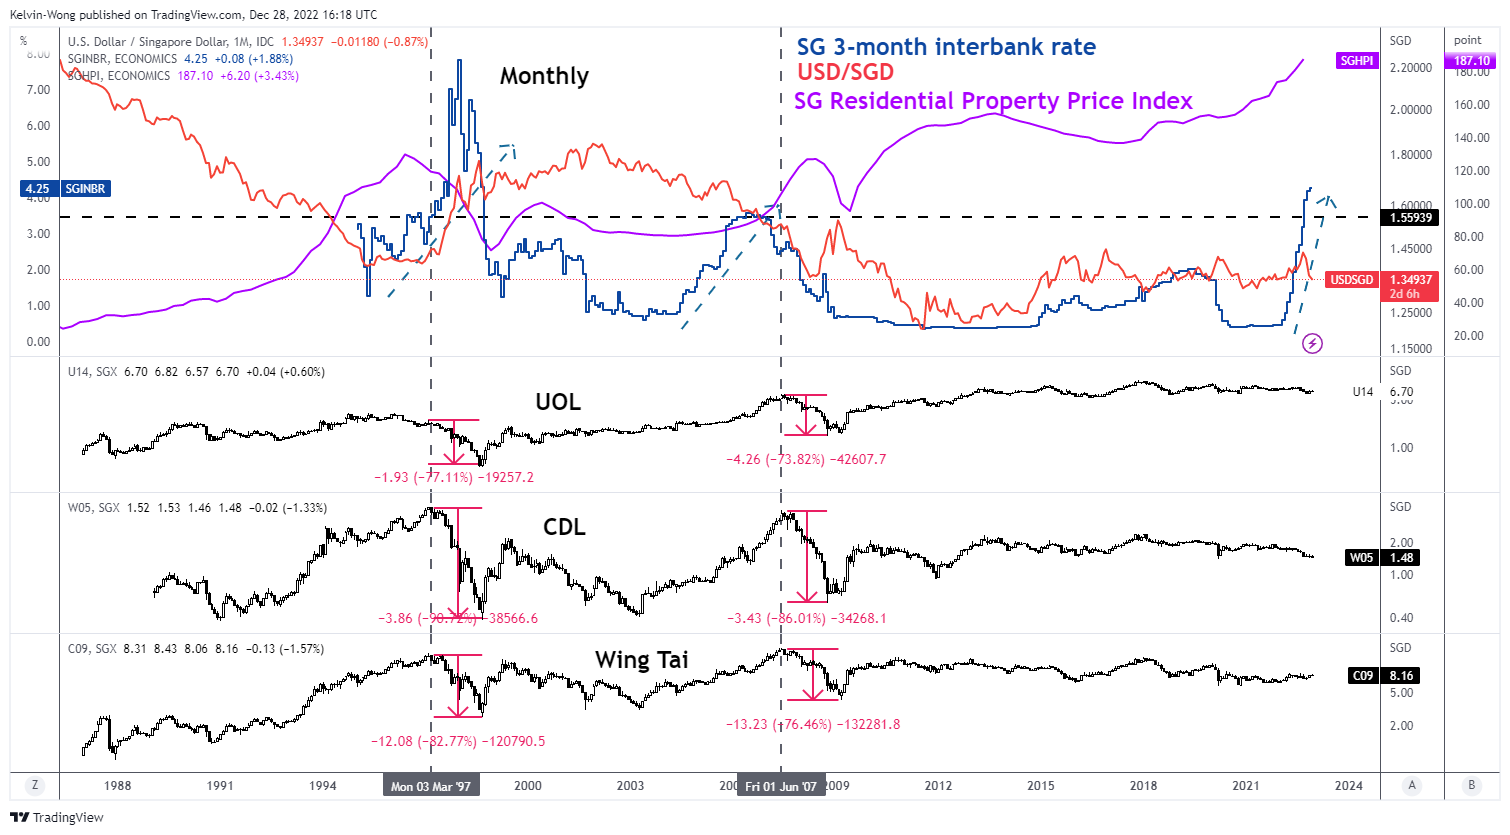
Source: TradingView as of 28 Dec 2022
Singapore residential property prices have continued to defy the law of global monetary tightening conditions as they continued to surge upwards in Q3 2022; the URA Residential Property Index hit a fresh record high of 187.10. In contrast, other developed nations’ property markets in the US, UK, Canada, and Australia have started to show signs of deflating.
Meanwhile, the Singapore benchmark 3-month interbank rate has recorded the steepest rise (in terms of timing & pace) since February 2022 and hit a 24-year high of 4.25% as of 28 December 2022. Past observations of similar steep increases in the 3-month interbank during periods of March 1996 to January 1998 and May 2004 to July 2006 have preceded a significant decline of 70% to 80% seen in the share prices of Singapore property stocks; UOL, CDL, and Wing Tai.
Hence, Singapore property stocks may be able to withstand the fury of such pronounced monetary tightening conditions and trigger a negative feedback loop thereafter in 2023.
Disclaimer
The content of this newsletter should not be construed as a solicitation to invest and/or trade. This is not trading/investment advice and all content is portrayed as opinion. Past performance is not indicative of future performance.