
Global Macro Weekly Playbook (25 Apr)
Credit crunch is coming to town

Greetings folks! Welcome to the latest edition of the “Global Macro Weekly Playbook” newsletter where we will be taking a deep dive into the common narratives to uncover macro mispricing and how it impacts the broad-based asset classes from a tactical perspective.
Recap for last week…
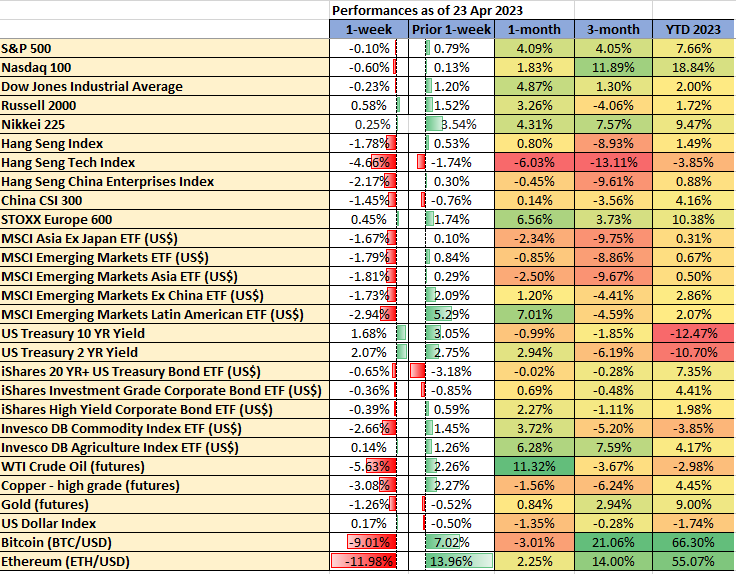
Data from TradingView & MarketWatch
Going forward...
US banking turmoil has subsided
A month has passed since the mini risk-off episode that shook the international financial markets triggered by the turmoil seen in the US regional banks due to the mismanagement of duration risk on their respective balance sheets.
So far, any outburst of systemic risk in the US banking system has subsided as indicated by the Cleveland Fed’s Systemic Risk Indicator derived from market participants’ sentiment reflected in the prices of options.
How do we interpret the Systematic Risk Indicator?
To sum up briefly; this risk indicator has three components, (1) the average distance-to-default (ADD) of a sample of approximately 100 US banks, (2) the portfolio distance-to-default (PDD) of the same sample banks, and (3) the spread or difference between ADD and PDD.
ADD captures the average insolvency risks, a falling ADD value (measured in standard deviations) indicates the market’s perception of average insolvency risk is raising.
PDD captures insolvency risk for a weighted portfolio of the same sample banks. Falling PDD (measured in standard deviations) is another indication of rising average insolvency risk.
The spread (ADD – PDD) is the most useful measure; narrowing the spread when falling PDD convergences towards ADD indicates stress in the banking system.
Data from 2000 to the present indicate that when the spread (ADD – PDD) is less than 0.1 for more than two days it indicates stress, and if it stays below 0.5 for an extended amount of time, it indicates that the markets are signaling major stress about the banking system (click here for more details).
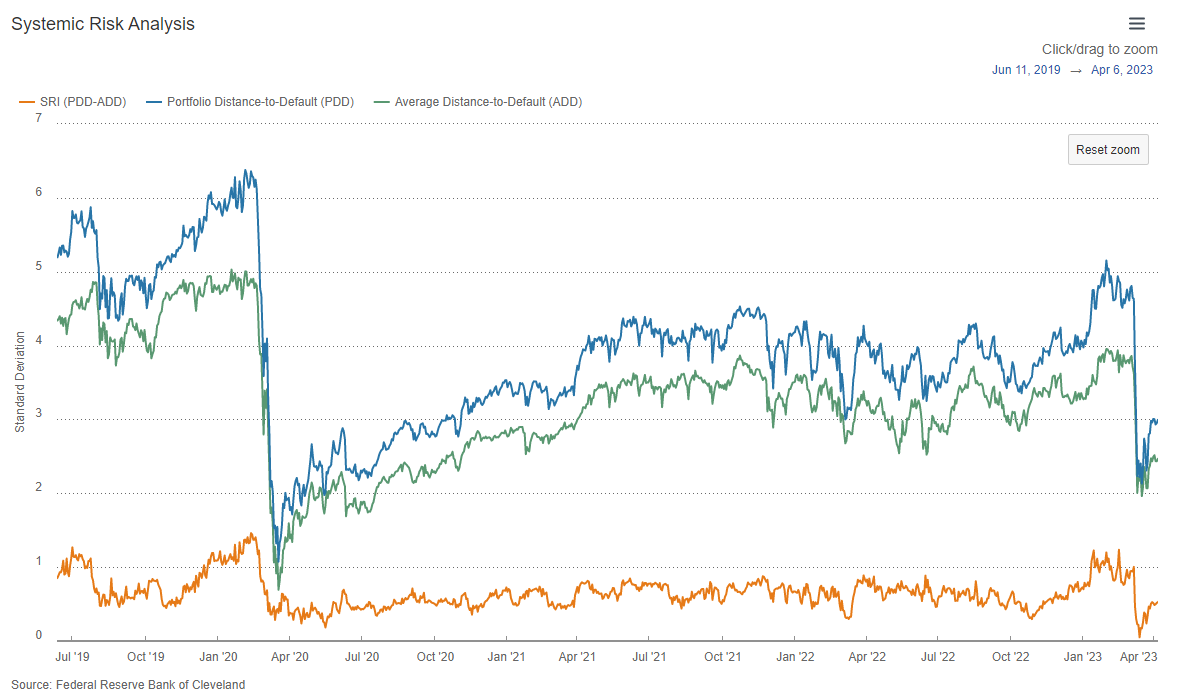
As seen from the above chart, the spread (ADD – PDD) of the Cleveland Fed’s Systemic Risk Indicator as of 6 April 2023 has increased to 0.5 from 0.0 printed on 15 March.
Compressed US high-yield corporate bonds credit spread at risk of widening
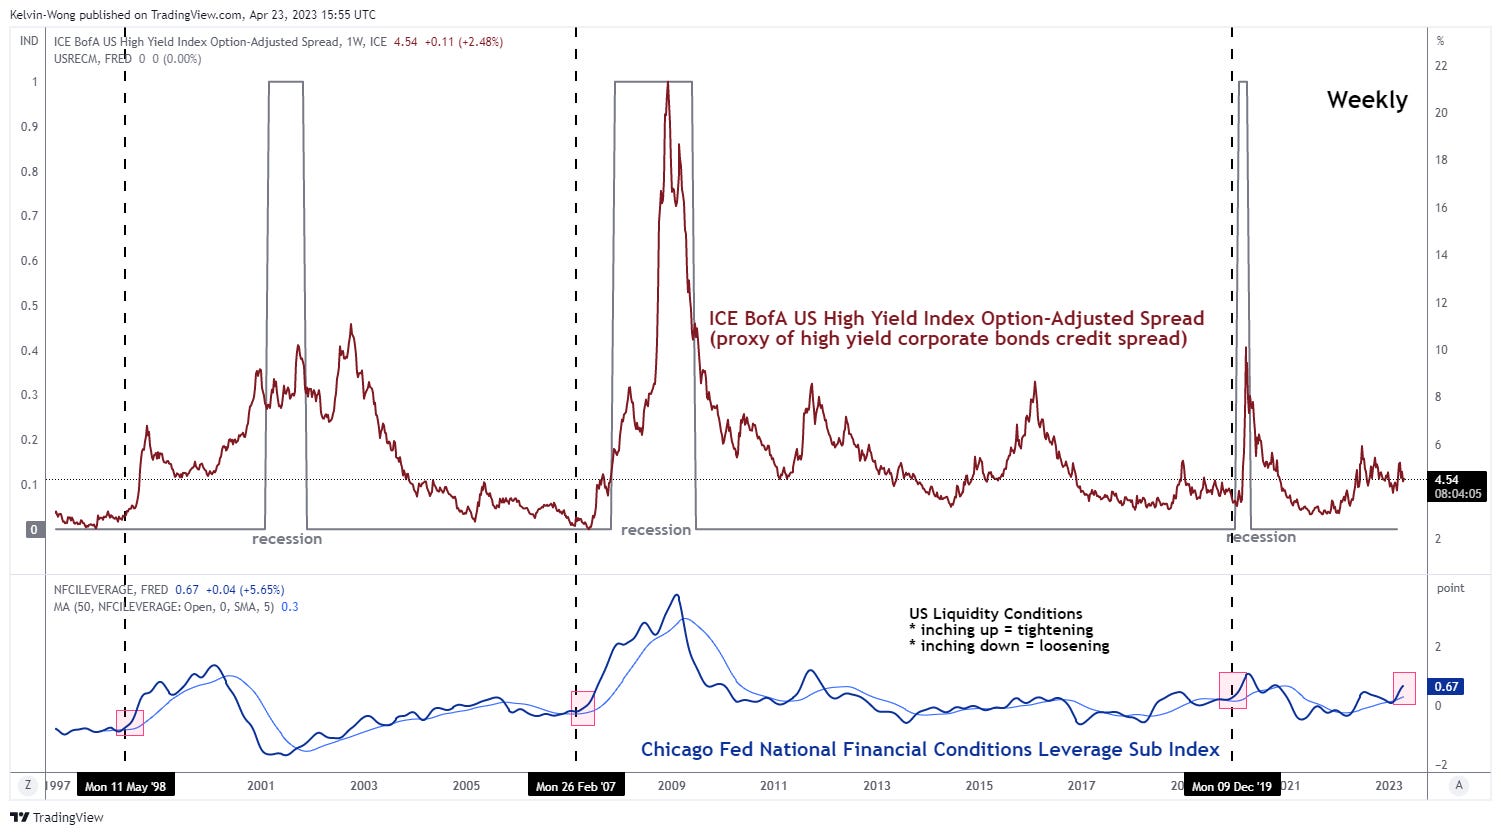
Source: TradingView as of 21 Apr 2023
An up move in the ICE BofA US High Yield Index option-adjusted spread represents a widening of the credit spread (corporate bond yield – US Treasury yield) that indicates an increase in default risk for US high-yield corporate bonds, and vice versa for a narrowing of the credit spread where default risk decreases.
Even though the systemic risk in the US banking sector has toned down as highlighted earlier, the risk of a rising credit crunch is still a “live event” where banks cut back on loans which in turn triggers a negative ripple effect on economic and profit growth for corporates.
One of the ways to gauge credit crunch risk is to use financial conditions indicators such as the Chicago Fed’s National Financial Conditions Index where its leverage subindex component consists of debt and equity measures, it has started to trend higher to 0.67 based on current data for the week ended 14 April 2023 that surpassed the previous peak of 0.46 printed on the week of 11 July 2022.
Interestingly, the latest observation on the Chicago Fed’s National Financial Conditions Leverage Sub Index has preceded a significant widening of the ICE BofA US High Yield Index option-adjusted spread thereafter in periods of 11 May 1998, 26 February, and 9 December 2012. Hence, we cannot rule out the possibility that a similar imminent widening of the US high-yield corporate bonds credit spread may occur at this juncture.
US small-cap equities (Russell 2000) are at risk of a bearish reversal due to the imminent credit crunch
The US small-cap listed companies as represented by Russell 2000 benchmark stock index tend to have weaker pricing power, lower margins, and a weaker balance sheet compared to their large-cap counterparts, resulting in conditions that are disadvantageous in the face of a widening of US high-yield corporate bonds credit spread that implies a rise in default risk of small-cap companies as most of these firms have similar credit ratings that are below investment grade.
Also, these small-cap listed companies face higher downside repricing on their equity values as the 12-month forward price-to-earnings (PE) ratio of the Russell 2000 is much “higher/richer” versus the S&P 500 at 22.00 versus 18.2 based on data from Yardeni Research as of 24 April 2023.
FX volatility may start to increase as G10 JPY crosses have shaped significant reversal movements
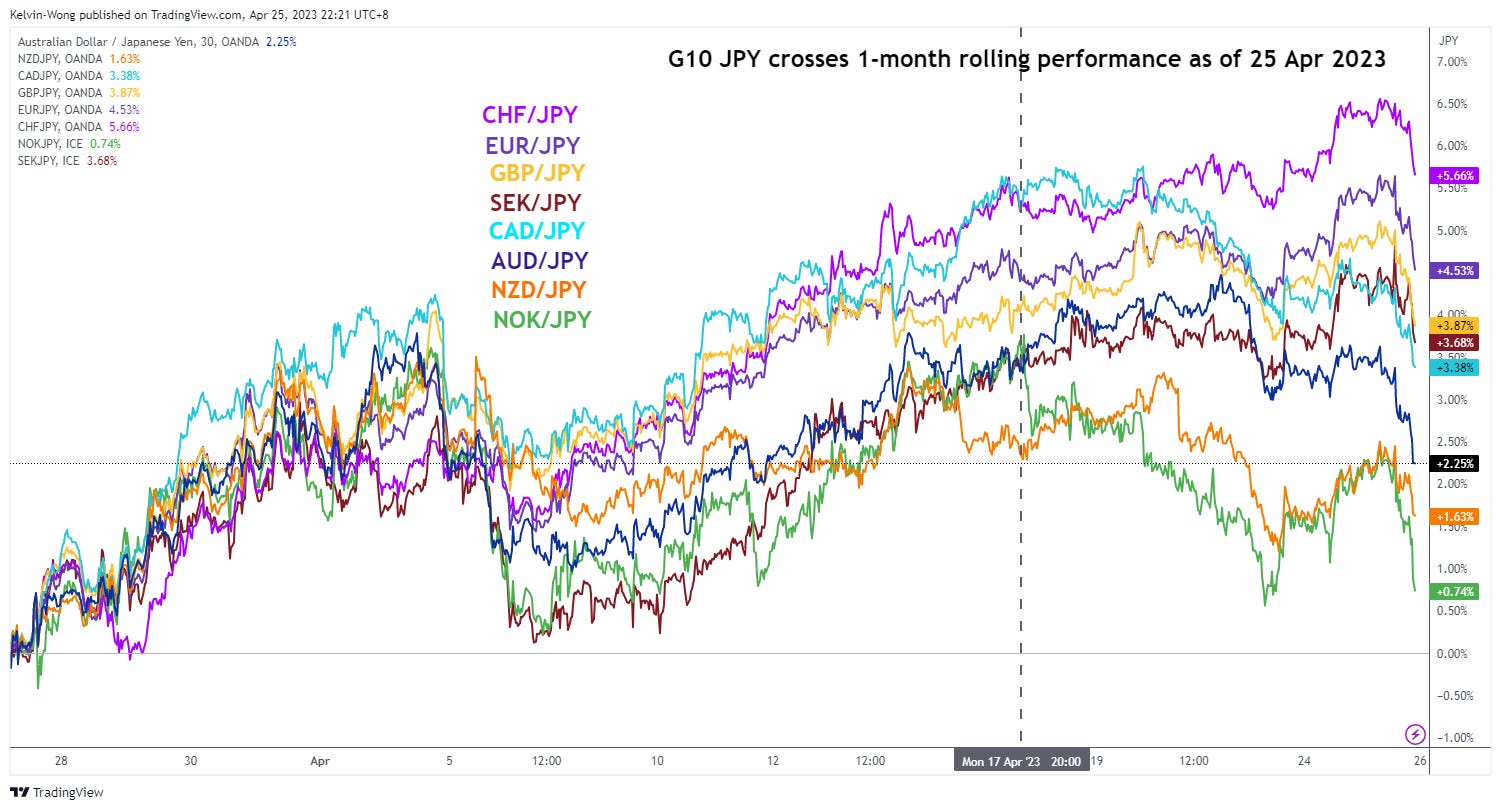
Source: TradingView as of 25 Apr 2023
The G10 JPY crosses have started to exhibit a risk-off liked behaviour due to concerns about global growth expansion and the possibility of a weaker than expected US Big Tech earnings results and guidance that cannot justify their recent rallies in the month of March led the Nasdaq 100 to record a 20% gain (the best performing developed benchmark stock index in Q1 2023) due to optimism of added on productivity features/services from AI technology and “safe haven status” plays during the onset of the recent mini US banking crisis.
As for the concerns about global growth, the focus is on the will of China policymakers to implement further liquidity measures to boost domestic economic growth which in turn drives up Chinese consumers and corporate’s spending and investment in international goods and services. That’s a very much needed “support” for the global economy given that the rest of the developed nations’ central banks are still in a tightening mode on their respective monetary policies (except Japan for now in the near term).
The latest guidance from China’s central bank PBoC has indicated that it prefers a “wait and see” approach before implementing any further accommodative measures as recent key economic data such as housing, consumer spending, and industrial production are now in recovery mode.
Therefore, it is interesting to note that the commodities-related JPY crosses (proxies of global growth); NOK/JPY, NZD/JPY, and AUD/JPY have led the recent downside reversal since 17 April 2023 as illustrated on the above chart.
A widening of US high-yield corporate bonds credit spread precedes significant movements on a JPY carry trade basket
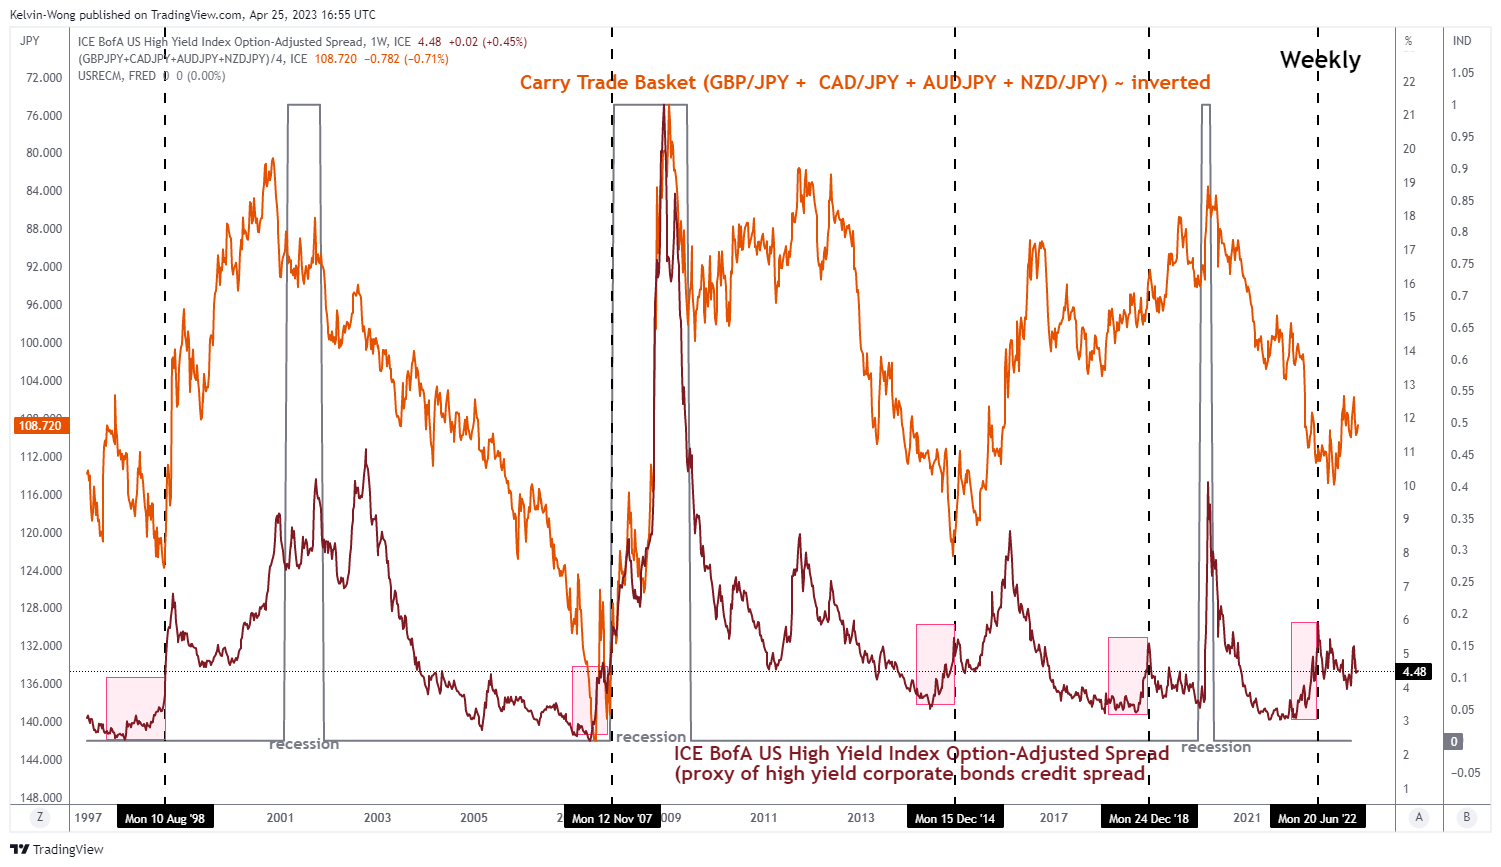
Source: TradingView as of 25 Apr 2023
We have highlighted earlier the elements that may trigger an imminent widening of the US high-yield corporate bonds credit spread.
Right now, the focus is on inter-market analysis; the pink-coloured shaded boxes in the above chart highlighted previous episodes in the significant widening of the credit spread in the weekly periods of 10 August 1998, 12 November 2007, 15 December 2014, 24 December 2018, and 20 June 2022 have led to a similar movement of the inverted JPY carry trade basket (equal weightage of GBP/JPY, AUD/JPY & NZD/JPY).
The above-mentioned correlation also has logical economic reasoning as a widening of high-yield corporate bonds credit spread indicates a rising default risk. For such a scenario to take shape, we need to have a credit crunch that led to a slowdown in global growth, which eventually tends to have a negative feedback loop into the JPY crosses due to JPY being a “traditional safe haven and funding currency” of choice by market participants.
Gold bullish positioning has not reached “overcrowding” status
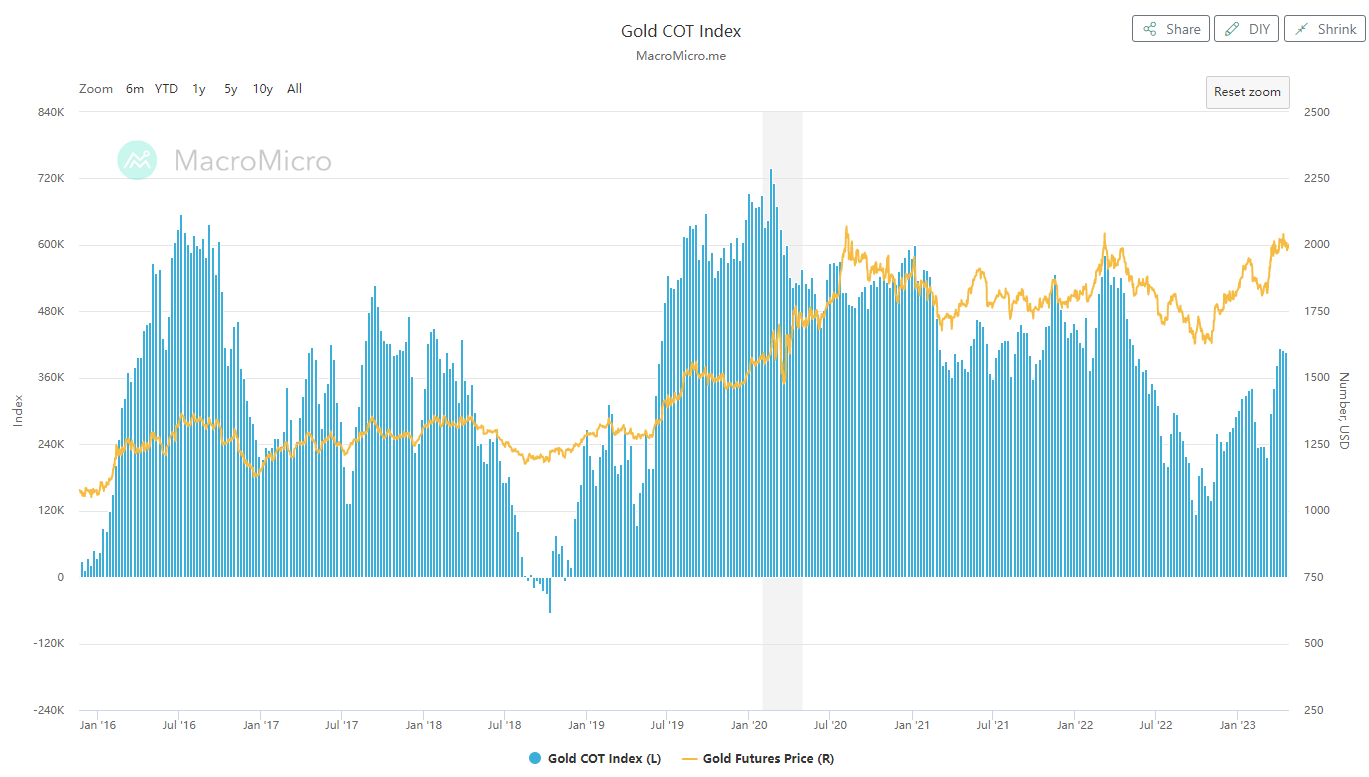
Source: MacroMicro as of 18 Apr 2023
Based on the latest data from the CFTC’s Commitments of Traders report as of 18 April 2023, the net long open positions of large speculators in gold futures are at 406, 318 contracts which are still below the 581, 334 net long contracts recorded on 7 March 2022 held by large speculators during the frenzy of the Russia-Ukraine war.
Thereafter, the price of gold futures printed a high of US$2,078/ounce on 8 March 2022, just a whisker away from its August 2020 all-time of US$2,089/ounce before it tumbled in the next six months and recorded a decline of -22%. Right now, the price of gold futures has reversed up from its Nov 2021 low of US$1,618/ounce and rallied by +27% to print a recent high of US$2,063/ounce on 13 April 2023 and pull-backed by -4% to print a low of US$1,980/ounce on 19 April 2023.
The last 2 weeks of price actions of gold futures have exhibited similar traits in early March 2022 where it rallied close to its all-time high of US$2,089/ounce and failed to surpass above it. Thus, there is some chatter in the marketplace that it may face the risk of a similar multi-month decline seen from March 2022 to November 2022.
However, the latest net-long positioning of large speculators has not reached a stage of extreme optimism and overcrowding status. Hence, the odds of a long squeeze scenario that can lead to a dramatic decline in the price of gold are low at this juncture.
Global Macro Charts Of The Week – curated based on integrated technical analysis (fractals, momentum & graphical)
New additions…
E-mini Russell 2000 futures (RTY) – At the risk of a retest of major support at 1,640
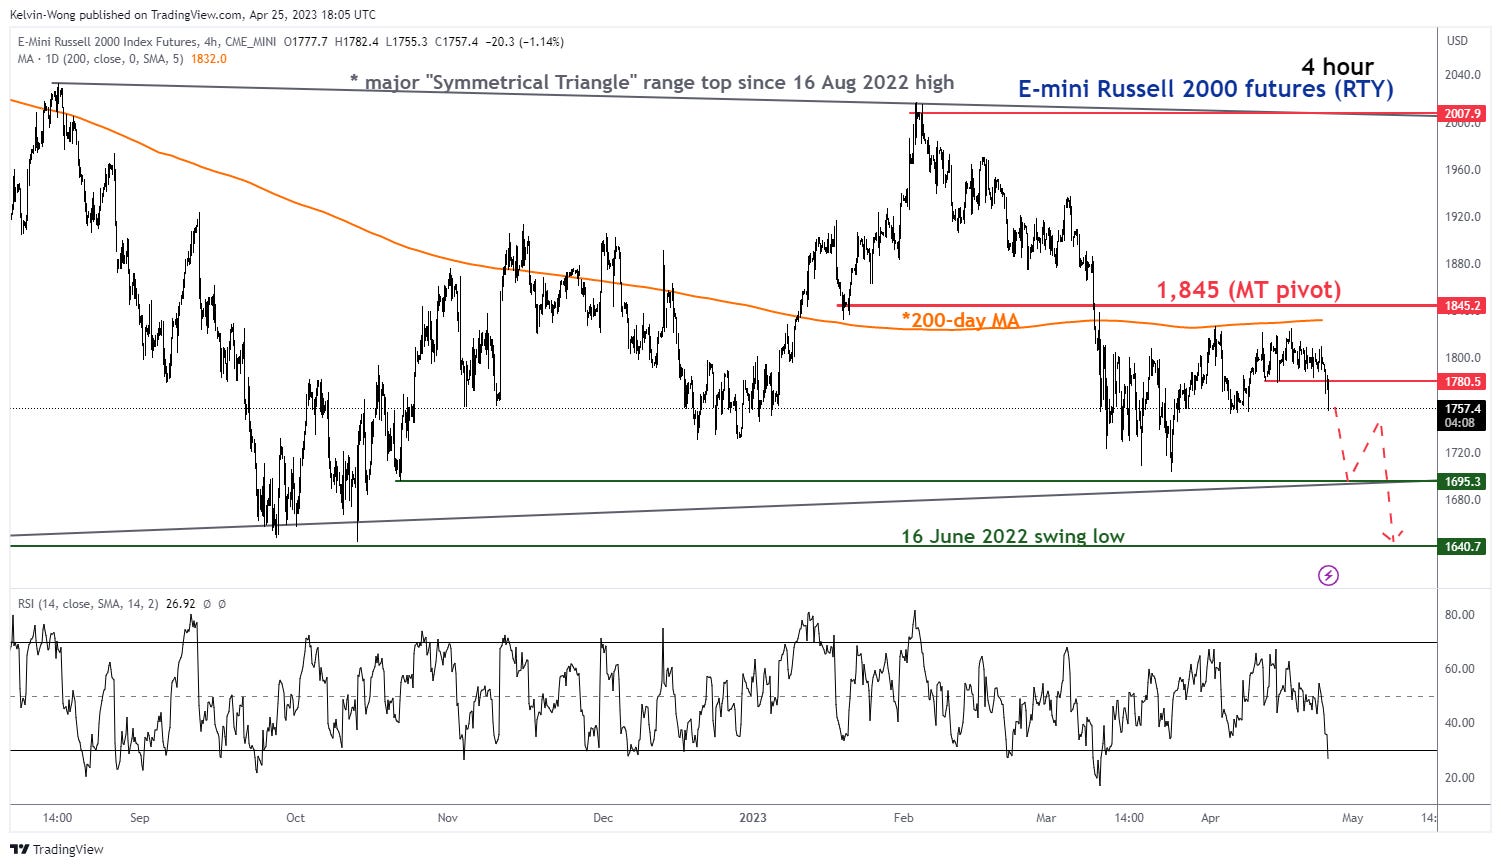
Source: TradingView as of 26 Apr 2023
Since its 16 June 2022 swing low, the price actions of RTY have evolved into a 10-month “Symmetrical Triangle” range configuration.
The recent rebound of 7% after a recent retest close to the Symmetrical Triangle” range on 24 March 2023 has failed to make a breakthrough above the key 200-day moving average.
If the 1,845 key medium-term pivotal resistance is not surpassed to the upside, RTY may see a further push down to retest the “Symmetrical Triangle” range support at 1,695 and a break below it exposes the 16 June 2022 swing low of 1,640.
On the other hand, a clearance with a 4-hour close above 1,845 negates the bearish tone for a squeeze up toward the “Symmetrical Triangle” range resistance at 2,007.
Short-term Tactical Global Macro Model Portfolio
Below is a summary table of assets from prior newsletters’ “Global Macro Charts Of The Week”
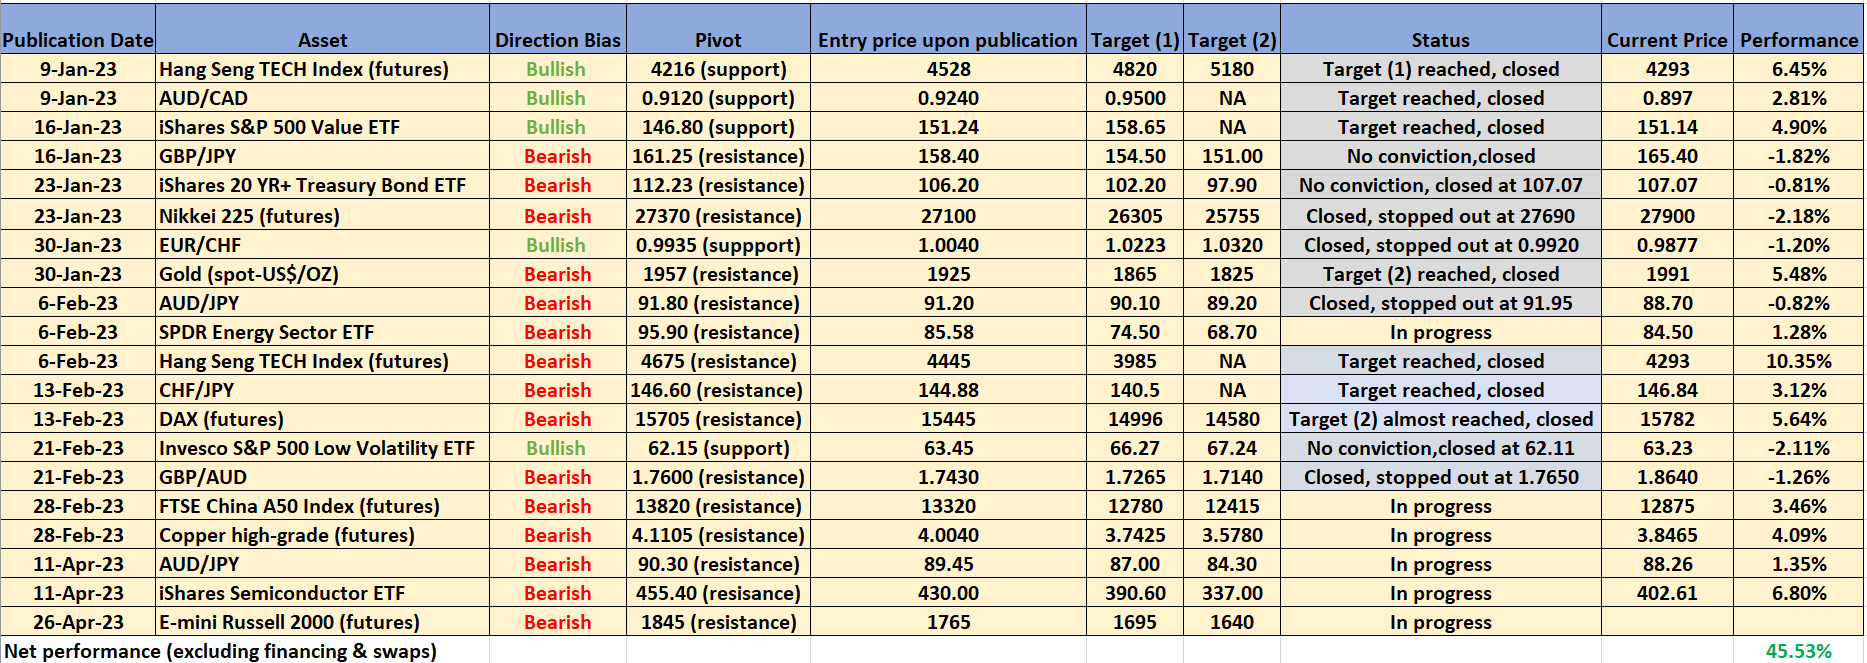
Source: TradingView as of 25 Apr 2023
Disclaimer
The content of this newsletter should not be construed as a solicitation to invest and/or trade. This is not trading/investment advice and all content is portrayed as opinion. Past performance is not indicative of future performance.
That’s all for today. I hope you enjoyed my analyses; do feel free to forward them to your friends, and colleagues. Remember to subscribe to the newsletter for the latest updates.
What do you think about Friday's BoJ and the monetary policy review horizon?