

Global Macro Weekly Playbook (14 Jun)
Global Macro Weekly Playbook (14 Jun)
FOMO in US stock indices while positive animal spirits reemerged in HK & China stock markets

Greetings folks! Welcome to the latest edition of the “Global Macro Weekly Playbook” newsletter where we will be taking a deep dive into the common narratives to uncover macro mispricing and how it impacts the broad-based asset classes from a tactical perspective.
Recap for last week…
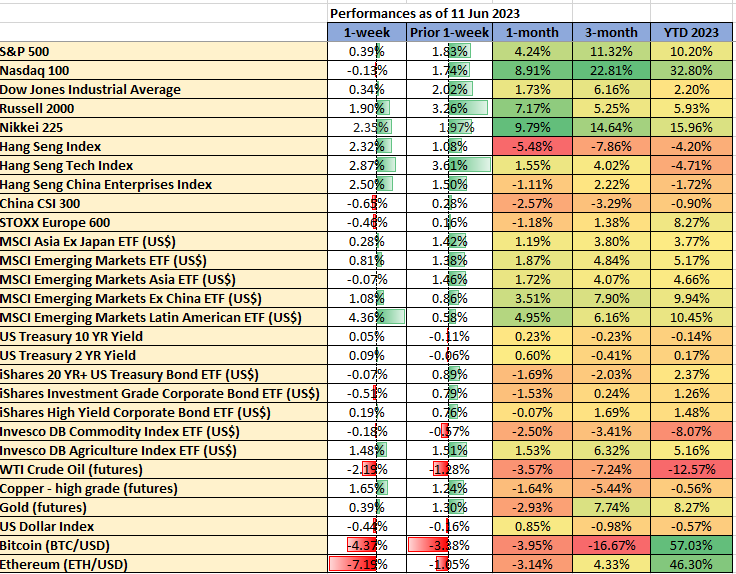
Data from TradingView & MarketWatch
Going forward...
Liquidity conditions are going to get tighter except in China
A potential resurgence of positive animal spirits in HK & China stock markets
A puff of relief for global financial markets as the US White House administration and the Republican party-controlled House managed to strike a debt ceiling suspension deal after it hit the US$34.1 trillion statutory limit before the “X-Date” of 5 June by US Treasury Secretary Janet Yellen. This debt ceiling suspension deal will last for two years until 1 January 2025 has been signed off.
Both the S&P 500 and Nasdaq 100 have surged into “bull market territory” with gains of +20% and more from their respective October 2022 lows.
The recent optimism in the “safe haven cum AI-driven” US mega-cap technology equities seems to be ignoring or complacent on a potential looming liquidity drain in the financial markets ex-post US debt ceiling extension deal.
The US Treasury will be a furor of US Treasury bills (T-bills) issuance to faster shore up its dwindled cash reserves to meet its debt and payment obligations. The US Treasury’s operating cash balance stood at US$22.89 billion as of 1 June, its lowest level since September 2017.
Hence, the US Treasury needs to replenish its coffers by a total issuance of around US$1.1 trillion worth of T-bills in the second half of 2023 which can be absorbed by banks’ reserves via deposits and overnight funded trades with the Federal Reserve as well as money market mutual funds. If more absorptions are done via money market mutual funds, the strain on liquidity is likely to be muted.
On 7 June, the US Treasury said in a statement that it has targeted an end-of-June cash balance of about US$425 billion.
2-year & 10-year US Treasury yields have continued to exhibit positive momentum
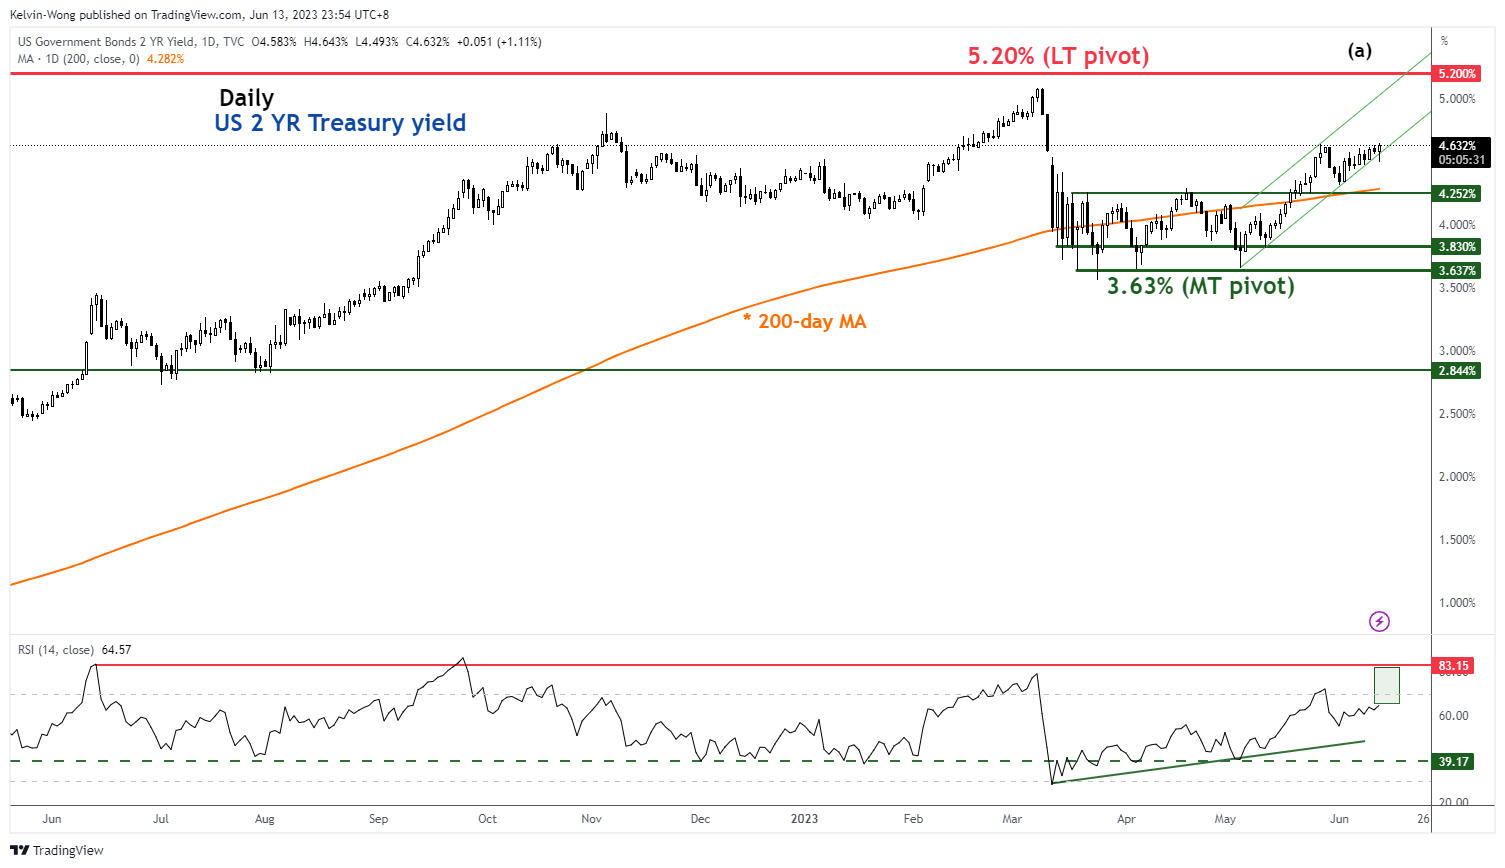

Source: TradingView as of 13 Jun 2023
The 2-year US Treasury yield which is more sensitive to US Fed’s monetary policy stance has continued to surge upwards within an ascending channel since the positive reaction from its 3.63% key medium-term pivotal support on 4 May 2023. The next key resistance will be at 5.20%.
Also, the benchmark “risk-free rate” to price corporate loans and bonds issuances, the 10-year US Treasury yield has risen by 33 basis points since the week of 15 May and surpassed the key upward-sloping 200-day moving average to last trade at 3.79%, a level that preceded the onset of the recent US regional banking turmoil in mid-March. Key intermediate resistance at 3.90% and clearance above it triggers a potential bullish breakout towards the next resistance at 4.46%
Rising 2-year sovereign bond yields is a global phenomenon except for Japan & China
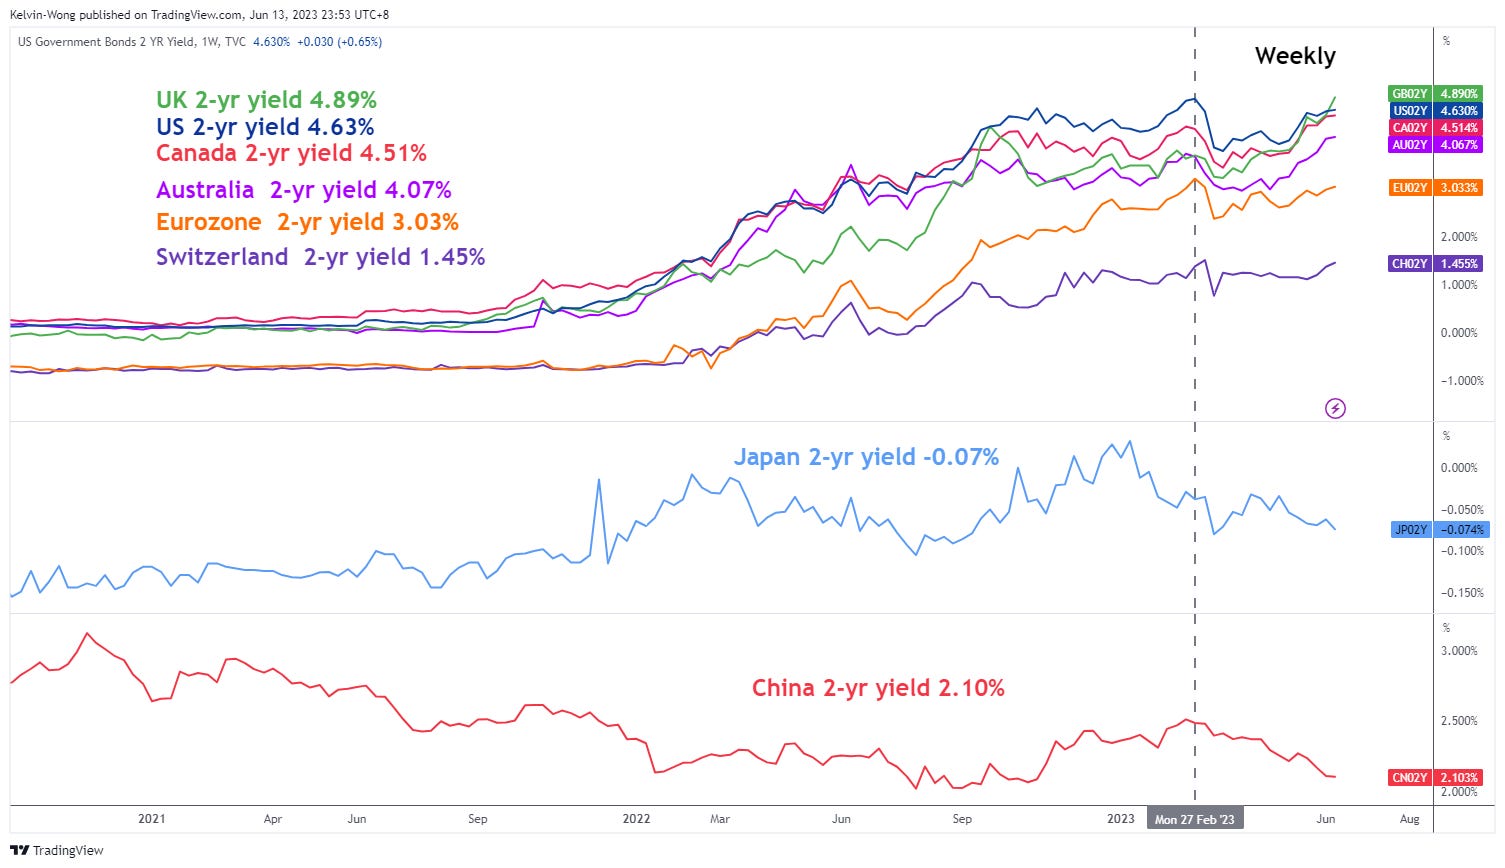
Source: TradingView as of 13 Jun 2023
The 2-year sovereign bond yields of the UK, Canada, and Australia have surpassed their respective February 2023 highs with the latter two countries supported by BoC and RBA’s change of monetary policies stances from neutral to hawkish.
US financial stress conditions have started to tick higher

Source: TradingView as of 13 Jun 2023
The St Louis Federal Reserve Financial Stress Index has also started to tick up to its latest reading of -0.37 for the week of 29 May from -0.52 printed on the week of 8 May and formed a “higher low” which could indicate an early sign of liquidity tightening conditions.
US stock indices in FOMO mode & be wary of the newly crowned bull market of the S&P 500
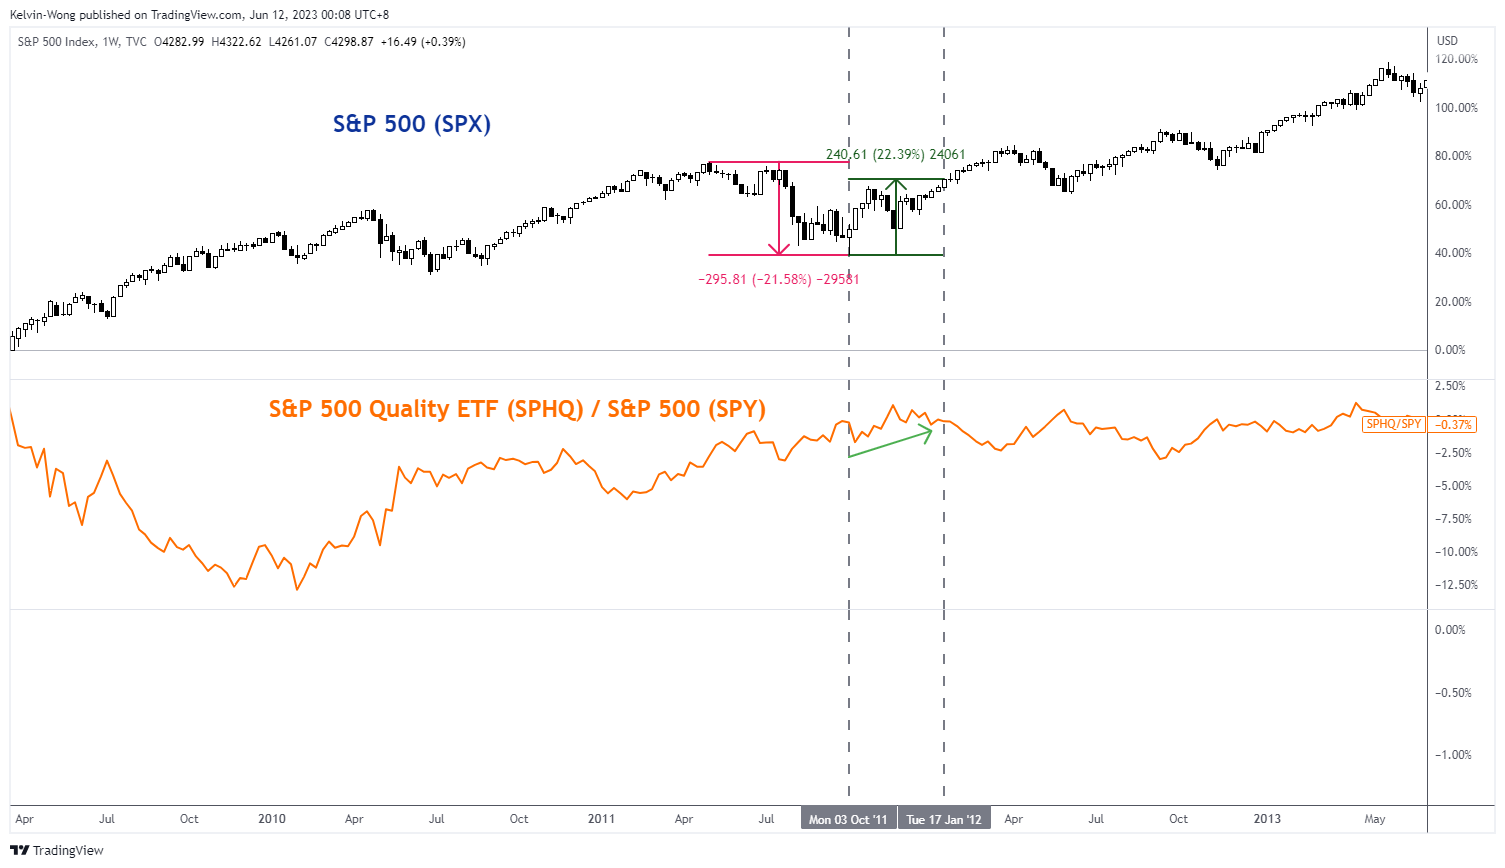

Source: TradingView as of 9 Jun 2023
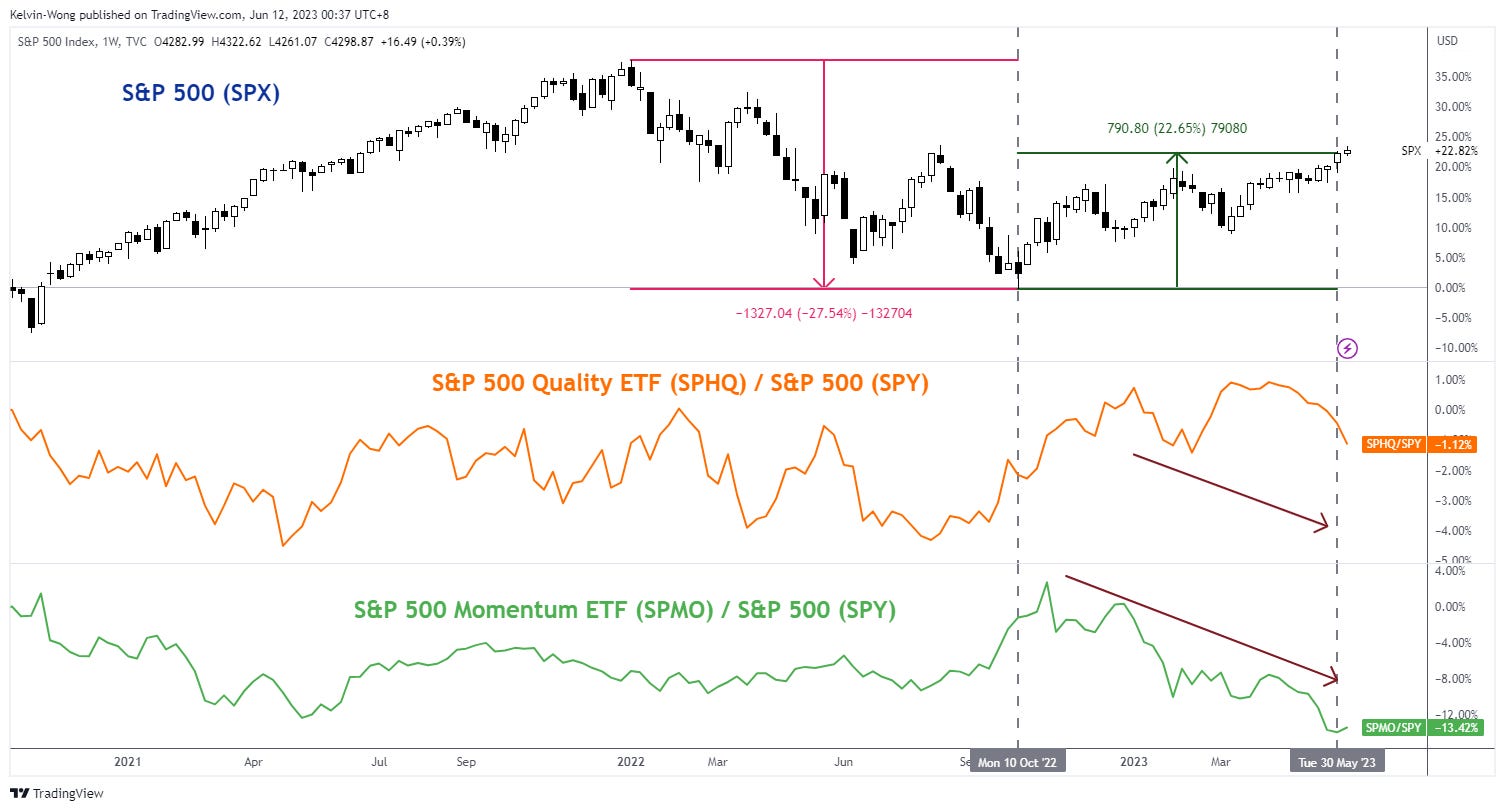
The period of the observed data on the S&P 500 will be based on its current ongoing long-term secular uptrend phase in place since its March 2009 low that has been primarily supported by the central bank’s liquidity.
The “Quality” and “Momentum” smart beta factors of the S&P 500 are obtained from the Invesco S&P 500 Quality (SPHQ) and Momentum (SPMO) exchange-traded funds; relative strength analysis is applied by plotting their respective price actions over the S&P 500 (ratios of SPHQ/SPY & SPMO/SPY) to gauge underperformance or overperformance against the S&P 500.
A point to note is that the Invesco S&P 500 Momentum ETF is only incepted in October 2015, hence there is no comparison of its SPMO/SPY ratio with the prior birth of a new bull market from October 2011 to 17 January 2012.
Based on the three prior births of a new bull market (defined as low to close) from October 2011 to January 2012, December 2018 to March 2019, and March 2020 to April 2020, both the Quality and Momentum factors outperformed the S&P 500 and in turn saw the benchmark index broke higher highs thereafter.
In contrast, this latest new bull market leg from October 2022 to June 2023 does not see the outperformance of Quality and Momentum factors which may give the current bull run a suspicious doubt on its sustainability.
The gap between US Treasury bonds’ implied volatility & S&P 500 VIX has remained wide
Source: TradingView as of 12 Jun 2023
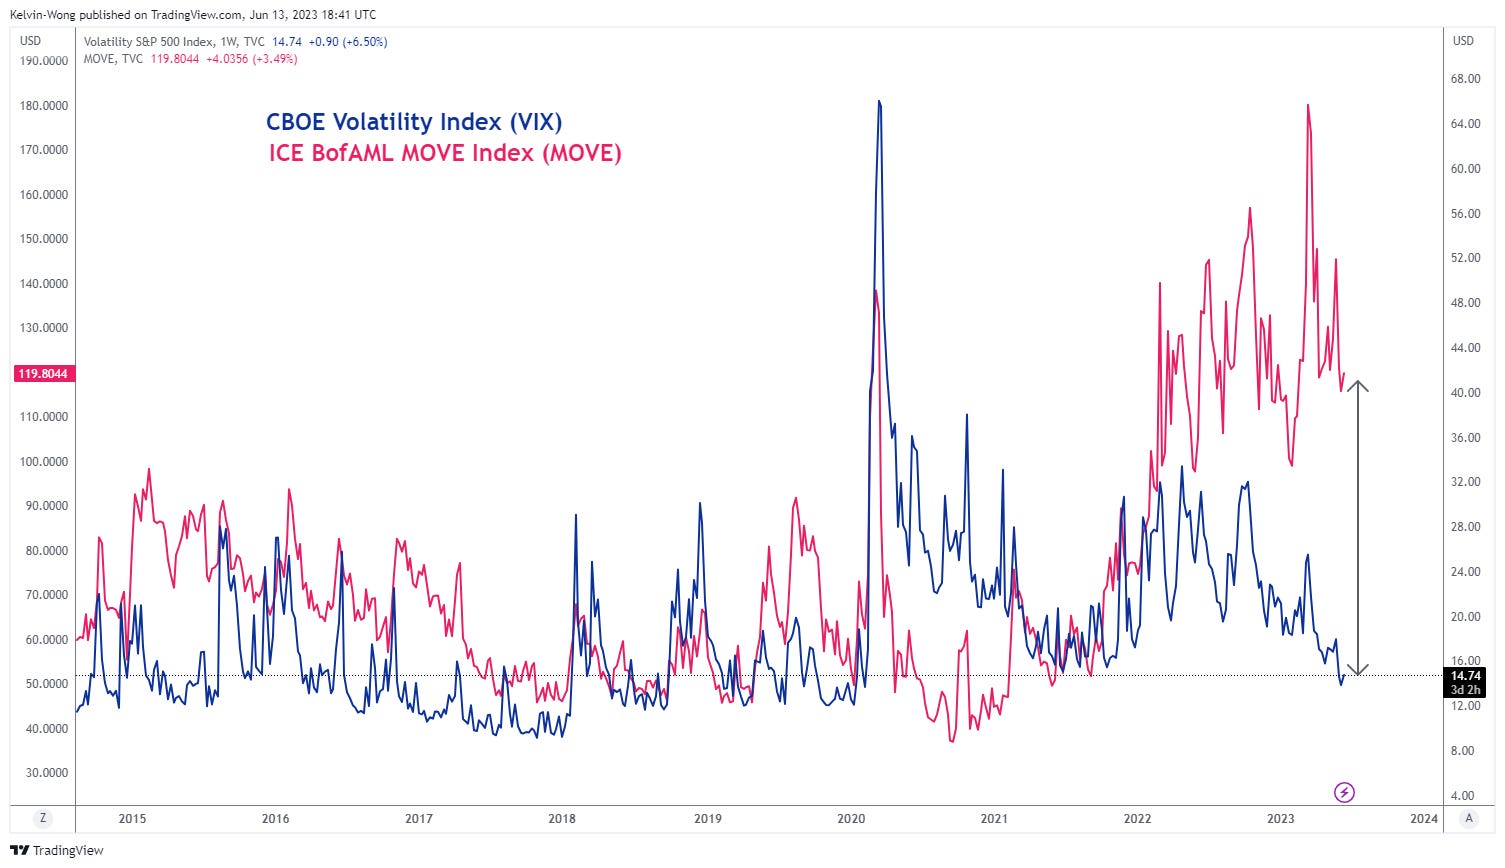
The implied volatility in the US Treasury bonds market inferred by the ICE BofAML MOVE Index has remained at an elevated level where it inched up on Monday, 12 May to 119.80. In contrast, the S&P 500 has continued to ignore the elevated level of the implied volatility of US Treasury bonds where its VIX (30-day implied volatility of the S&P 500) has continued to plummet to 14.75, its lowest level since mid-January 2020, before the pandemic crisis of February/March 2020.
These latest observations seen in the MOVE Index suggest that prices of US bonds may see further downside pressure and trigger a further rise in fixed income/bonds yields that create a potentially heightened liquidity squeeze environment.
China’s thematic exchange-traded funds listed in the US have started to outperform
Source: TradingView as of 13 Jun 2023
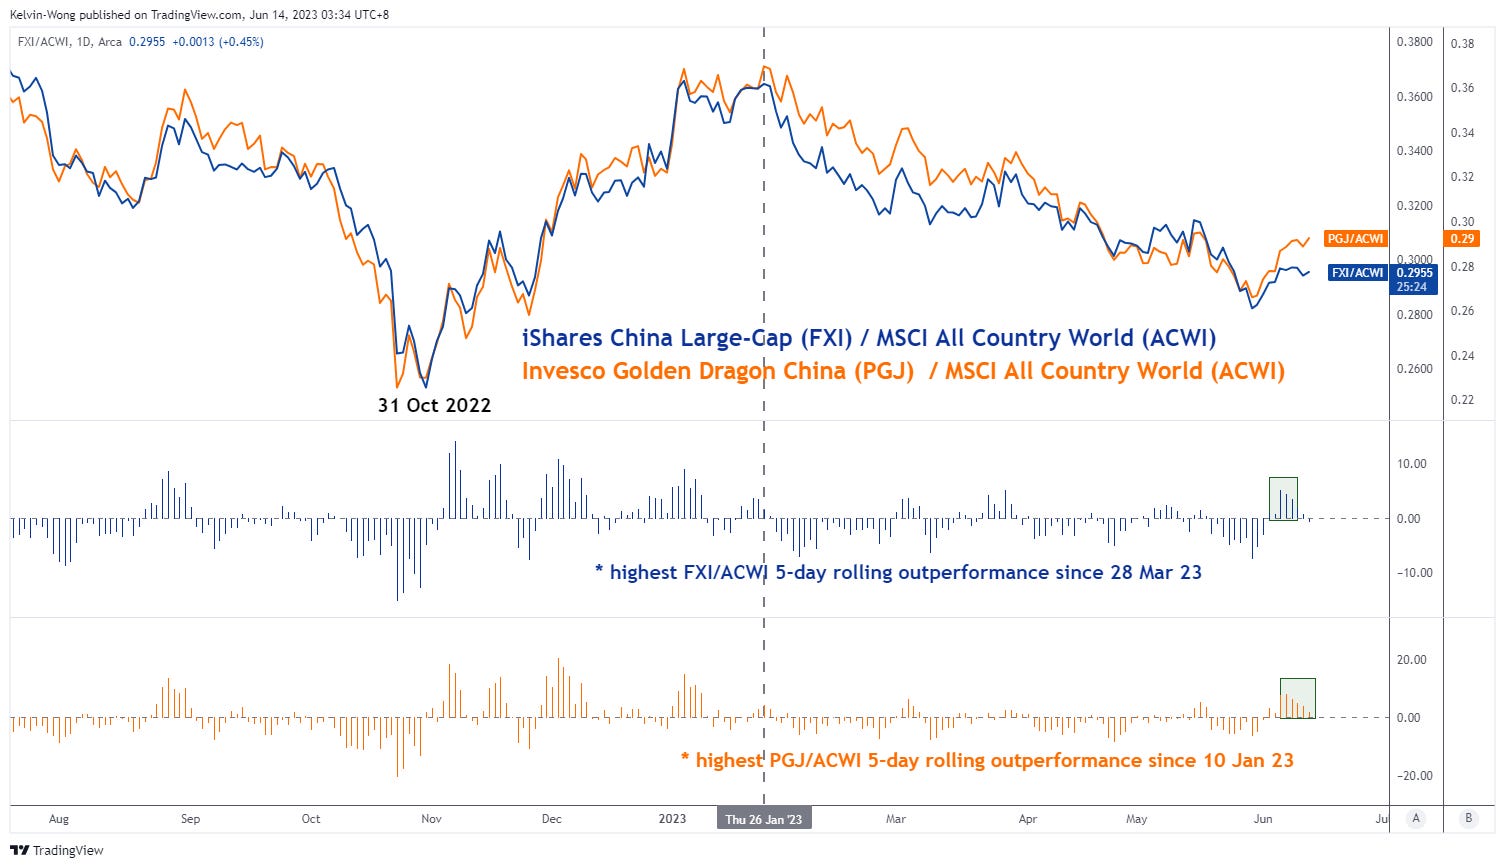
Since last 31 May 2023, there has been a tactical resurgence of positive animal spirits in the China stock market and its proxies reinforced by potential fresh fiscal stimulus as well as impending interest rate cuts from China’s central bank, PBoC to address the current weak internal domestic demand.
The Hang Seng Index, Hang Seng TECH Index, and Hang Seng China Enterprises Index have staged rallies of +8.2%, +13.3%, and +8.8% from 31 May’s lows to Tuesday, 13 June closing levels that outperformed the US S&P 500 (+4.8%) and MSCI Asia Pacific ex Japan (6.2%) over the same period.
From a relative strength analysis standpoint, the ratio charts of iShares China Large-Cap ETF and Invesco Golden Dragon ETF consisting of China Big Tech ADRs over the MSCI All-Country World Index ETF have indicated significant outperformance where the 5-day rolling performances of the iShares China Large-Cap/ MSCI All-Country World Index ratio and Invesco Golden Dragon/ MSCI All-Country World Index ratio jumped to their highest levels in around two and four months respectively.
New additions…
Hang Seng Tech Futures (HTI) – Bullish breakout above descending channel & 200-day MA

Source: TradingView as of 13 Jun 2023
The Hang Seng Tech Index has rallied by +13+% from its 31 May 2023 low of 3,564 and staged a bullish breakout above its medium-term descending channel upper boundary now turns pull-back support at 3,945.
In addition, its price actions have also traded above the key 200-day moving average. Even though the 4-hour RSI oscillator has reached an overbought condition (above 70%) , it has not flashed out a bearish divergence signal, suggesting that short to medium-term upside momentum remains intact.
Watch the 3,945 key medium-term pivotal support for a potential impulsive up move towards the 4,385 resistance in the first step. On the other hand, a 4-hour close below 3,945 damages the bullish tone for a slide back towards the next support at 3,730.
iShares Investment Grade Corporate Bond ETF (LQD) – At the risk of a bearish breakdown
Source: TradingView as of 13 Jun 2023
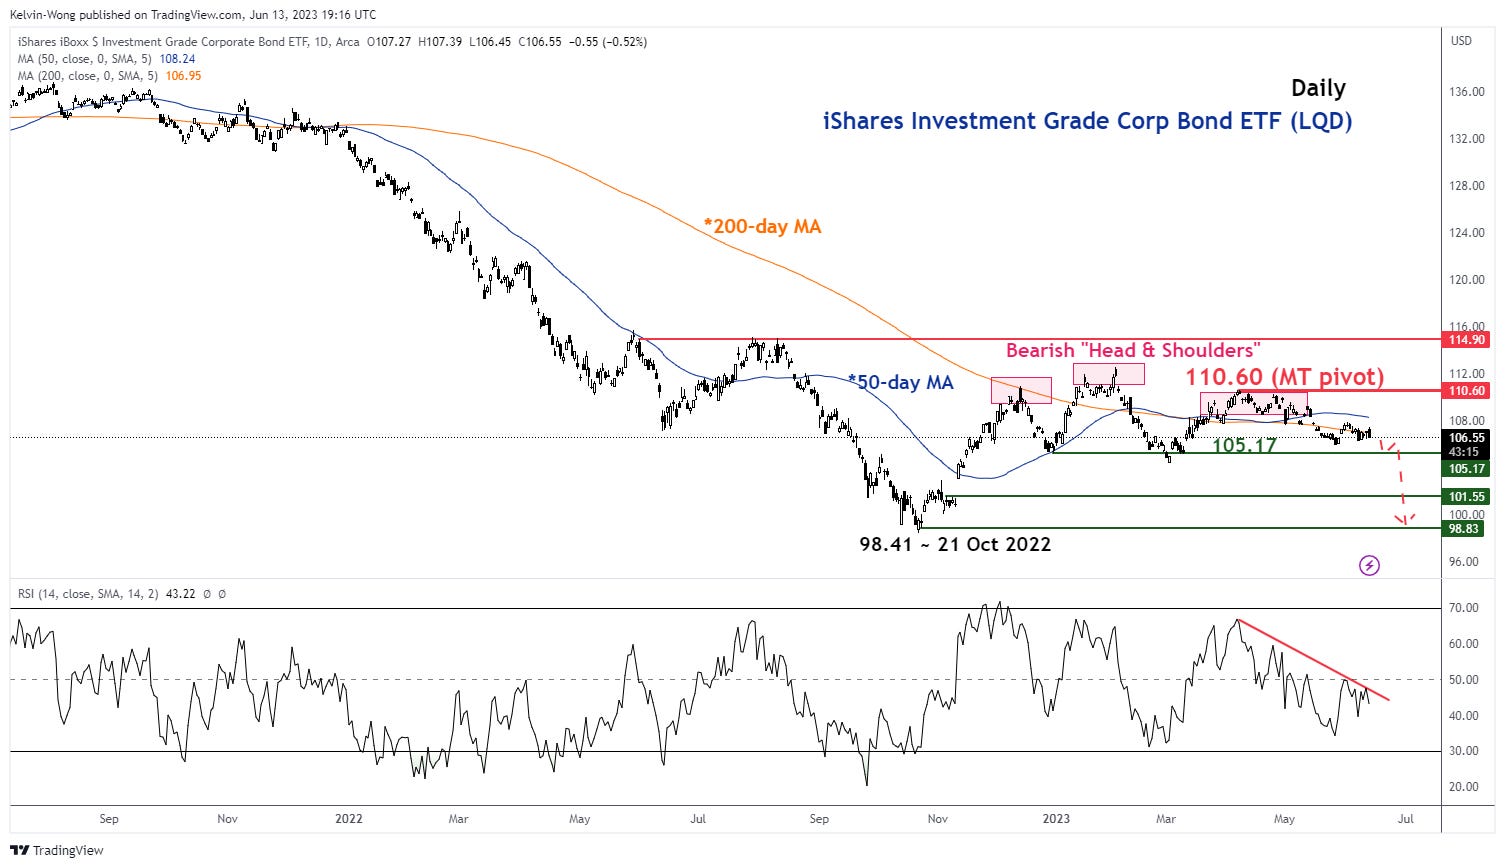
Since 13 December 2022, the price actions of LQD have traced out an impending medium-term bearish “Head & Shoulders” reversal configuration, and right now, it has almost completed the “Right Shoulder” which suggests a potential imminent breakdown.
A break below 105.17 support may trigger a further slide towards 101.55 and 98.83 in the first step. However, a clearance with a daily close above the 110.60 MT pivotal resistance invalidates the bearish scenario for a squeeze up toward the next resistance at 114.30.
Short-term Tactical Global Macro Model Portfolio
Below is a summary table of ideas from prior newsletters’ “Global Macro Charts Of The Week”

Source: TradingView as of 13 Jun 2023
Disclaimer
The content of this newsletter should not be construed as a solicitation to invest and/or trade. This is not trading/investment advice and all content is portrayed as opinion. Past performance is not indicative of future performance.
That’s all for today. I hope you enjoyed my analyses; do feel free to forward them to your friends, and colleagues. Remember to subscribe to the newsletter for the latest updates.