


Global Macro Weekly Playbook (13 Feb)
Time to be fearful

Greetings folks! Welcome to the latest edition of the “Global Macro Weekly Playbook” newsletter where we will be taking a deep dive into the common narratives to uncover macro mispricing and how it impacts the broad-based asset classes from a tactical perspective.
Recap for last week…
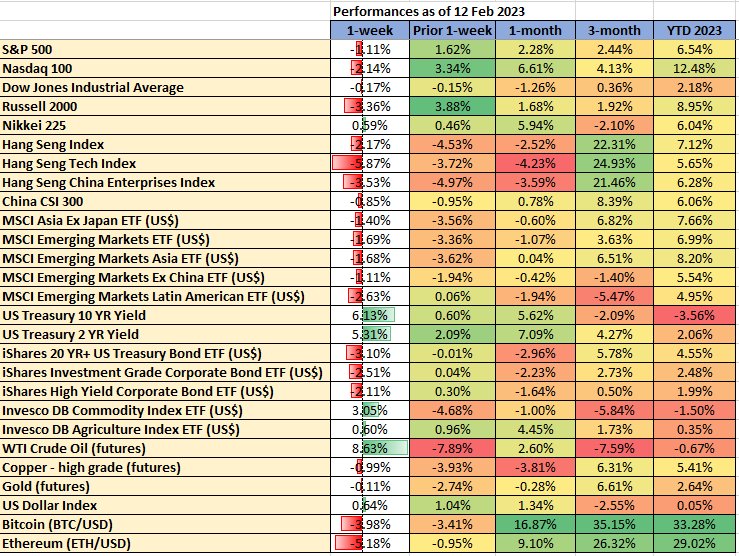
Data from TradingView & MarketWatch
Key economic data & events to watch for this week
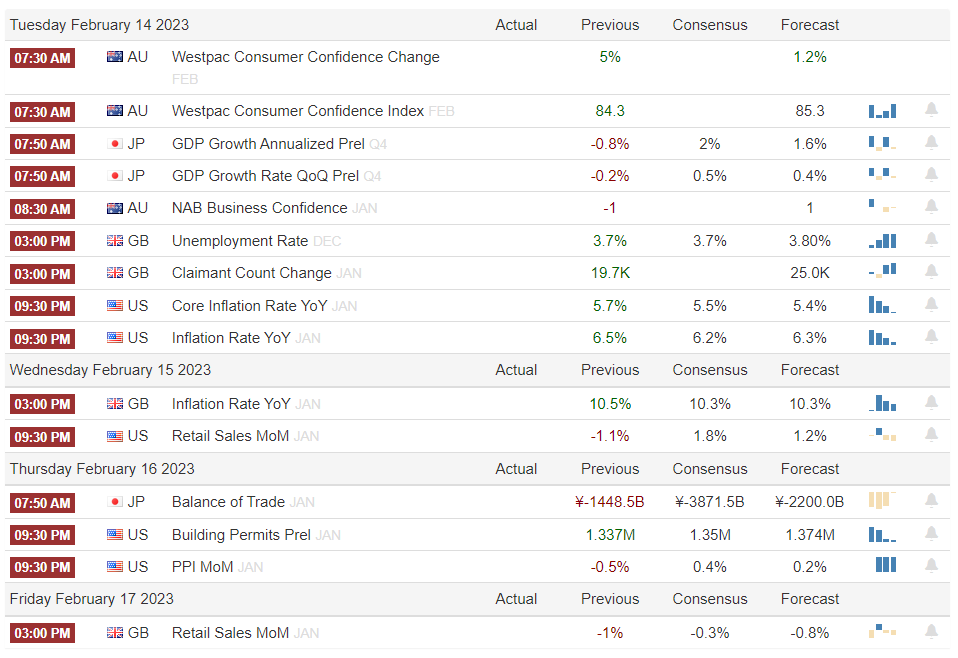
Source: Trading Economics (SG timing)
US Q4 2022 earnings season: coming to the tail-end of the reporting season; major firms to watch for this week will be Palantir, Coca-Cola, Roblox, Shopify, Cisco, and Applied Materials. A full table of notable reporting firms is as follows;

Source: Earnings Whispers
Going forward...
Who is incoming potential BOJ Governor Kazuo Ueda & implications on markets?
Last Friday, local Japanese news media reported that hot favorite, current Deputy BOJ Governor Masayoshi Amamiya (pro-QE) refused to take the top post to succeed Haruhiko Kuroda this April. The Japanese government has selected a preferred “out of the blue” nominee, Kazuo Ueda; a professor in economics and former BOJ board member.
This “shock revelation” has caught market participants off guard and triggered sharp moves in the JPY last Fri and even today (13 February) session. The ruling LDP Japanese government is scheduled to present the candidates for the BOJ’s new governor and deputy governors to parliament on Tuesday (14 February).
At the moment Kazuo Ueda is still considered a “mystery man” in terms of his monetary policy stance as he is not involved in BOJ’s monetary policy setting in recent years and his last tenure with BOJ as a board member was in 2005. If parliament approves Ueda’s nomination, it would be the first time in post-war Japan that an academic was appointed as BOJ governor, a role that had historically rotated between officials from the BOJ and the finance ministry.
Interestingly, the policy chief for Japan’s ruling LDP party, Koichi Hagiuda commented over the weekend that the current ultra-easy monetary policy should be maintained but has room for adjustment and reform. Also, he would expect the new BOJ policymakers to have a proactive approach.
In Japan, elected government officials and central bank policymakers work and cooperate closely to achieve economic goals. Hence, it seems that an imminent tweak towards a tighter monetary policy tilt may take shape under the new BOJ governor, especially on the ceiling and floor of the “Yield Curve Control” program that was expanded to 0.50% on either side in December. Core inflation in Japan increased to 4% y/y in December 2022, the most since December 1981, and above BOJ’s 2% target for a ninth consecutive month.
Japanese investors’ shift towards home bias from overseas assets may gain momentum
Based on the latest data from the Ministry of Finance and Japan Securities Dealers Association, Japanese investors inclusive of pension funds and life insurance companies sold a record US$181 billion of foreign debt and brought in 30.30 trillion yen worth of JGBs in anticipation of further upward pressure in the longer-term tenure JGB yields.
Thus, if the new BOJ governor adopts a tighter monetary policy going forward and scraps or further expands the cap on the 10-year JGB yield, there is still more than $2 trillion of overseas bonds held by Japanese investors left to potentially offload to convert back to home base. That’s going to be a huge capital inflow flight back to Japan.
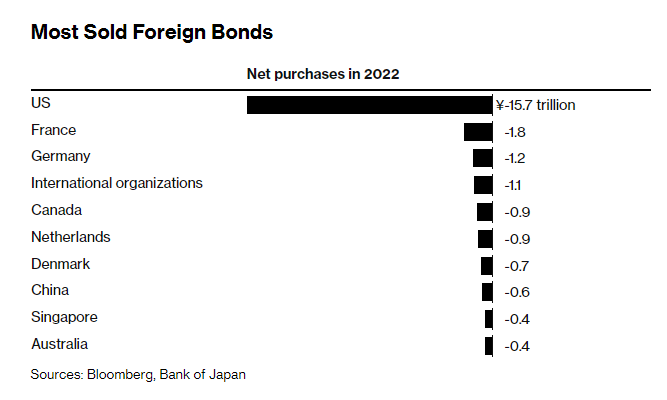
In addition, bonds issued by US entities were the top holdings of Japanese investors in 2022 that amounted to 135.1 trillion yen.

Share prices of Japanese banks may see further upside while real estate-related equities withered
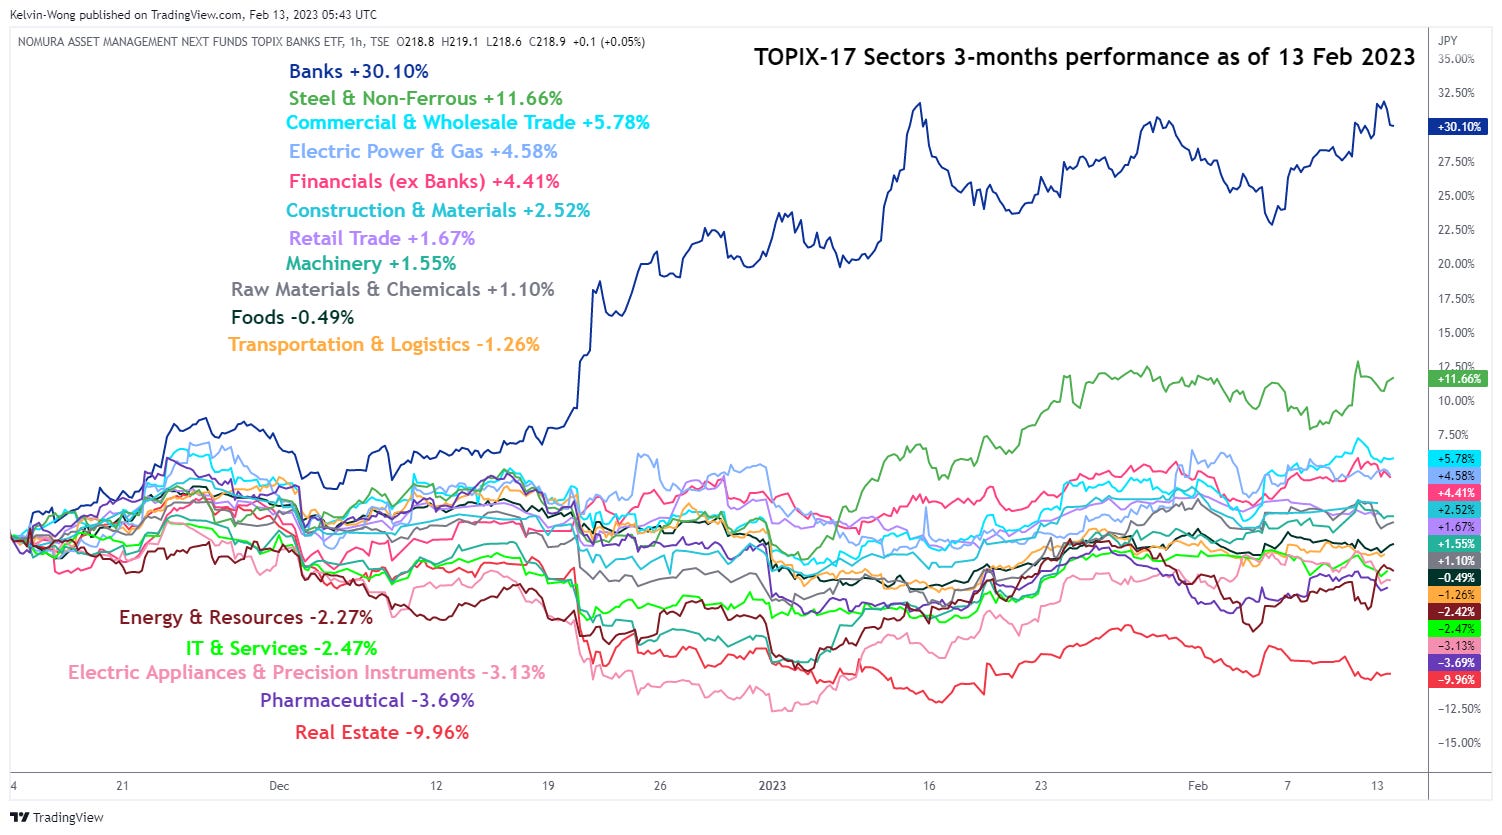
Source: TradingView as of 13 Feb 2023
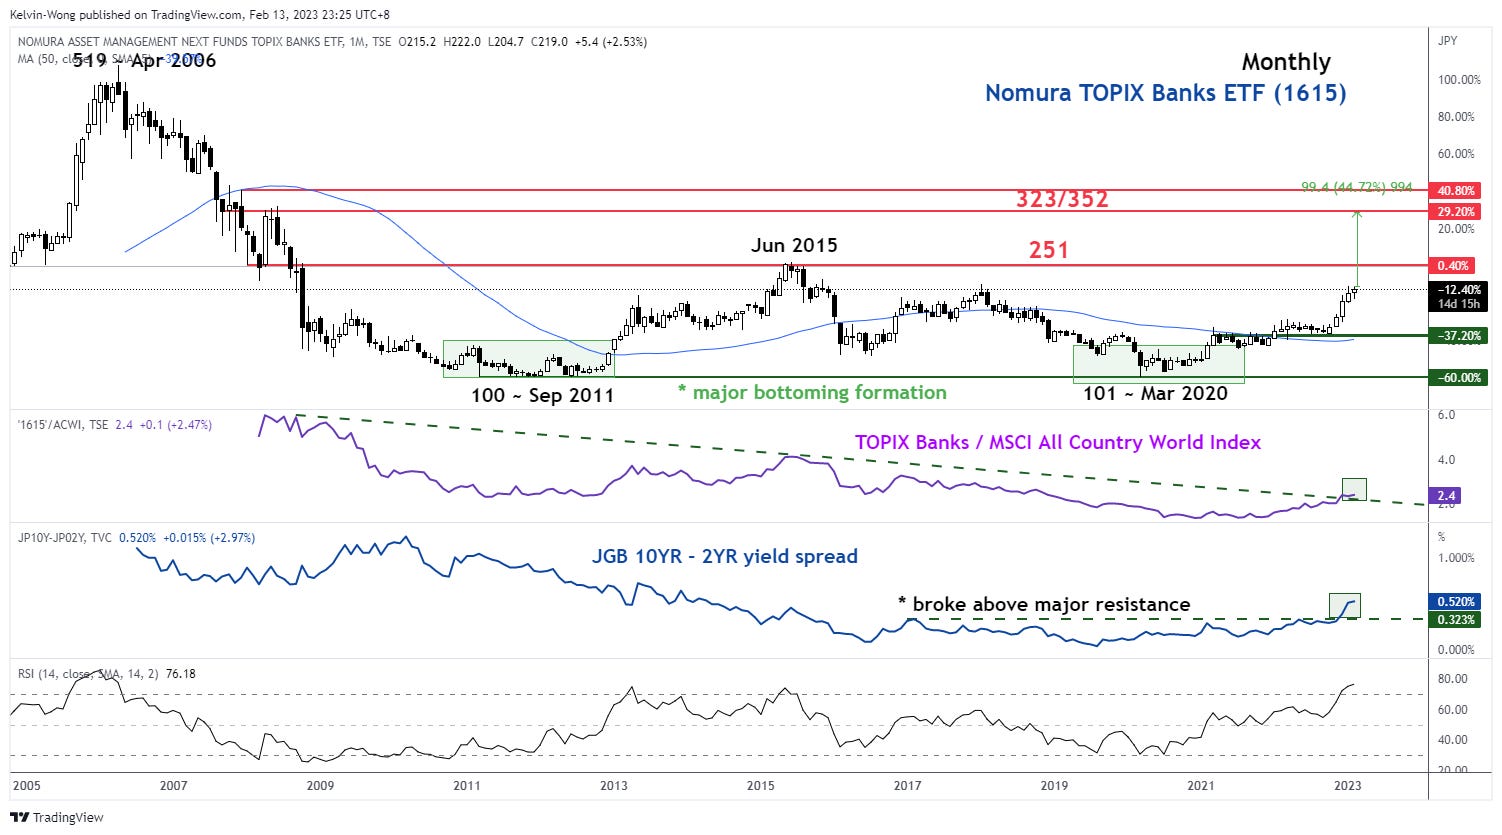
Based on the 3-month rolling performance of the TOPIX-17 Series Sectors ETFs, the Banks are outperforming the pack with a gain of +30.10% as of 13 February 2023 and a year-to-date return of +5.33% in anticipation of a further normalization in monetary policy where the yield spread of the 10-year JGB over the 2-year has widened by 36 bps since December 2022 to 0.52%; its steepest yield curve steepening seen in the past 13 years which in turn is likely to give a positive boost to Japanese banks’ net interest income margins.
In addition, an uptick in local loan demand may occur due to an indirect effect of a shift toward home bias by Japanese investors as highlighted above.
Source: TradingView as of 13 Feb 2023
From a technical analysis perspective, the TOPIX Banks ETF is evolving with a major bottoming formation that has taken shape since September 2011 with positive momentum. A clear break above 251 (the neckline resistance of the bottoming formation) may see a further bullish impulsive up move towards the 323/352 resistance zone which represents a gain of +44%
Bullish breakout seen in US breakeven inflation rates
Source: TradingView as of 10 Feb 2023
The highlight for this week’s economic data dump will be the US January CPI; the headline inflation is likely to have risen 0.5% m/m in January, the most since June 2022 which translate to a 6.2% y/y, a slowdown from 6.5% y/y printed in December 2022. Core CPI Is expected to increase by 0.4% m/m, bringing the annual rate to 5.5% y/y, a slight dip from 5.7% y/y recorded in December.
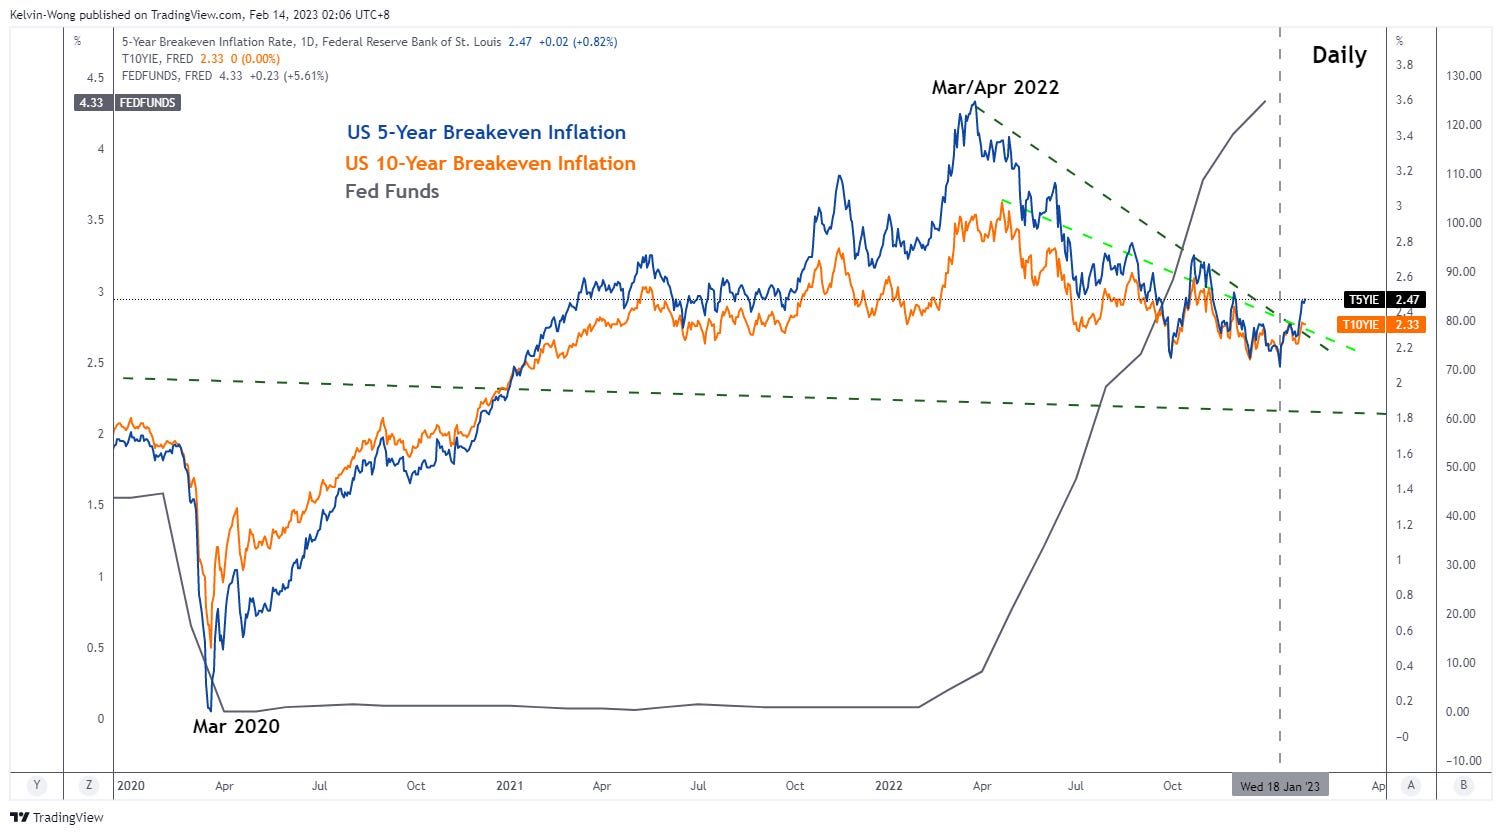
What is interesting is forward-looking inflationary expectations as perceived by market participants via tradable instruments; breakeven rates are derived by subtracting the yields of US Treasury inflationary-protected bonds (TIPs) from the yields of nominal US Treasury bonds.
In a nutshell, the 5-year breakeven rate implies the future US inflation rate 5 years from now, and the 10-year breakeven rate represents future US inflation 10 years from now.
Both the 5-year and 10-year breakeven rates have been trending lower since March/April 2022 and hit 2.09% and 2.12% respectively on 18 January 2023; close to the desired Fed’s inflation target of 2%. Hence, the recent slowdown in breakeven rates coincided with the “risk-on” rally seen in equities and risk assets as the Fed Pivot narrative takes hold.
In the past 2 weeks, both the 5-year and 10-year breakeven rates have started to rise and staged bullish breakouts from their intermediate trendline resistances to trade at 2.47% and 2.33% respectively as of last Friday, 10 February.
Therefore, the recent rise in implied forward-looking inflation rates in the US suggests that the lag CPI data is likely to be sticky and even faces the risk of an uptick in the near future. Hence, the current Fed Pivot narrative is being mispriced and equities/risk assets, in general, may see an imminent nasty decline.
Too much “Greed” at this juncture
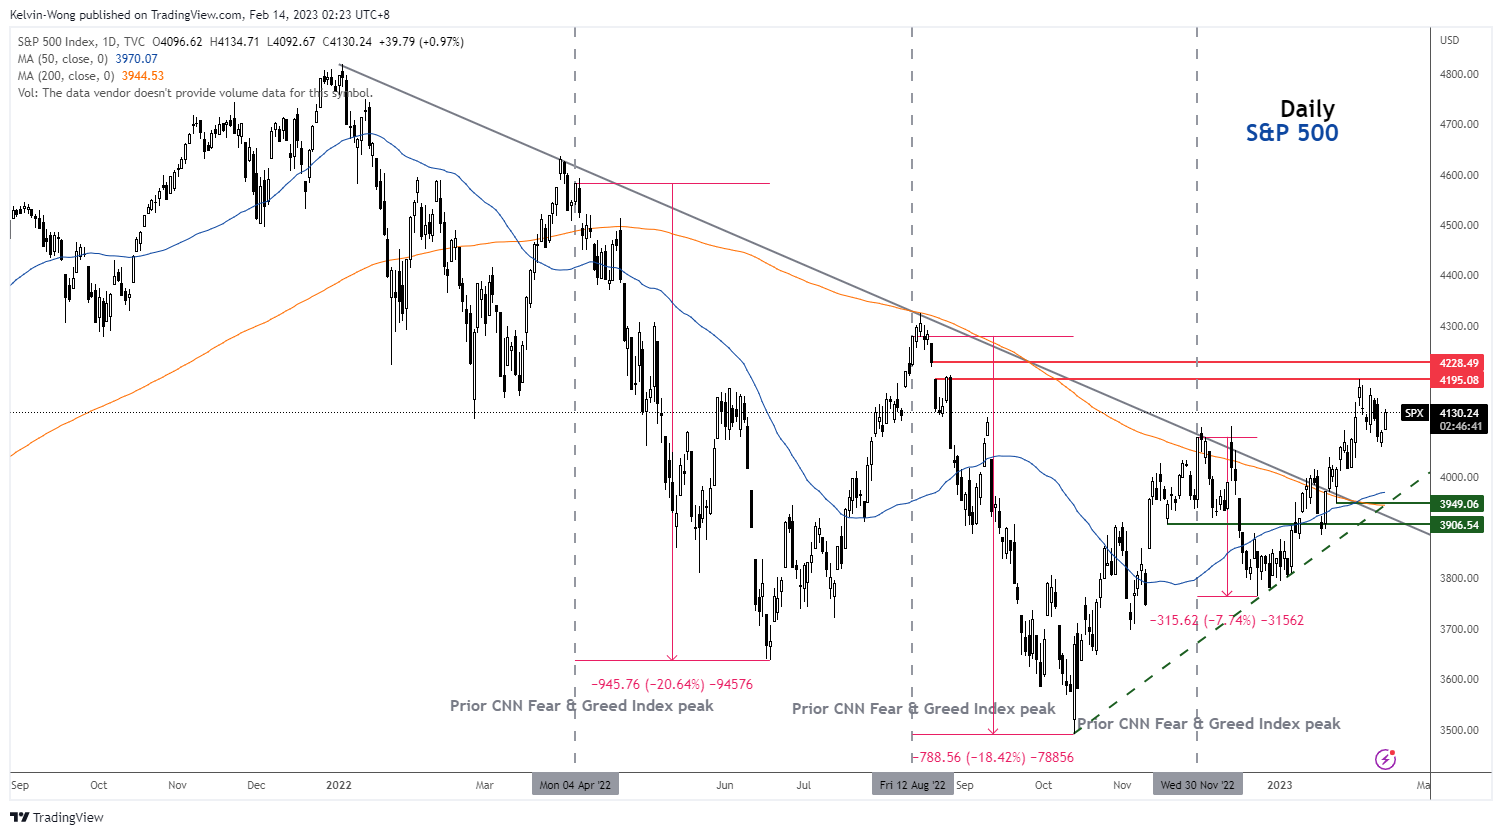
Source: TradingView as of 13 Feb 2023
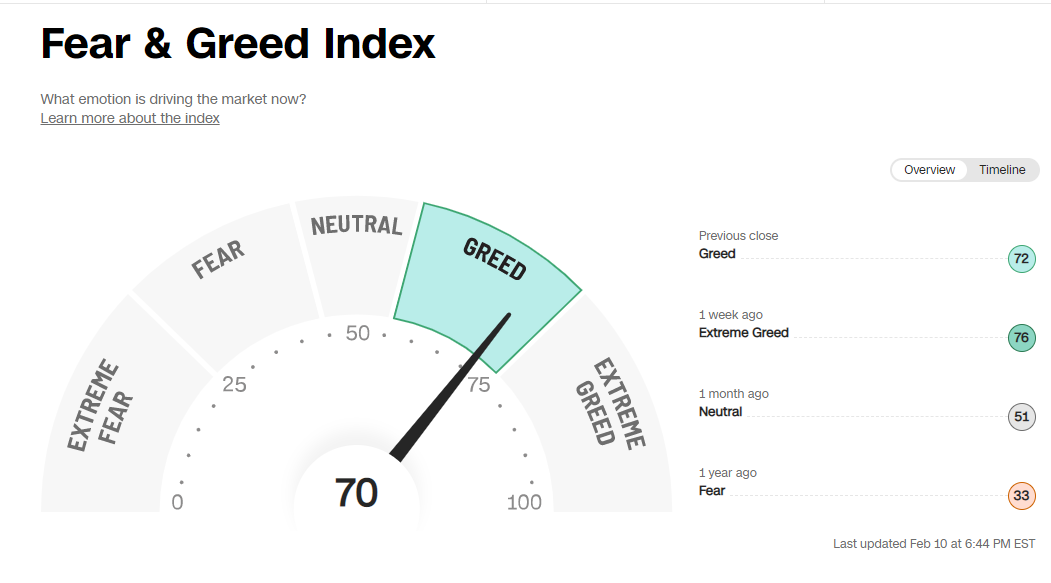
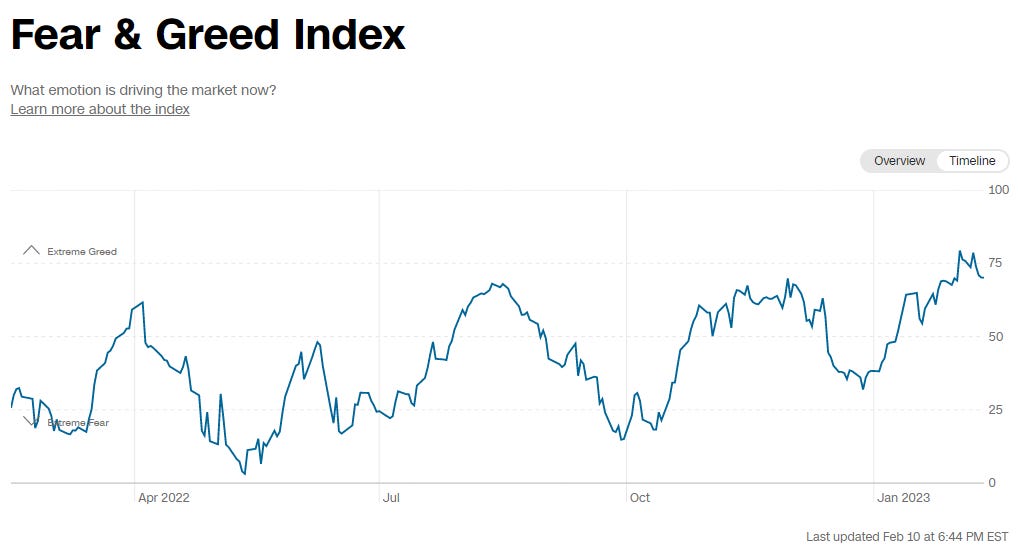
The Fear & Greed Index (by CNN) swung into "greed" territory from "extreme greed" a week ago.
From a historical trending perspective, its current level is higher versus 3 months, 6 months & 1 year ago; and its current 2-week high of 79 printed on 2 Feb 23 surpassed its prior peaks of 30 Nov 2022, 12 Aug 2022, and 4 Apr 2022.
Interestingly, these peaks led & coincided with significant declines of -8%, -18%, and -21% seen in the S&P 500 thereafter.
Also, the US 10-year Treasury yield has just broken above a key intermediate trendline resistance this Friday with positive momentum after a considerable bounce from its 3.30% key MT pivotal support that occurred two weeks ago=>perceived higher cost of funding going forward (click here for a recap).
Markets do not move vertically, the recent bullish run for equities & other risk assets since late Oct 22 has hit overstretched zones, prudent to set tighter trailing stops and play defensive at this juncture.
Germany DAX is at risk of forming a medium-term top
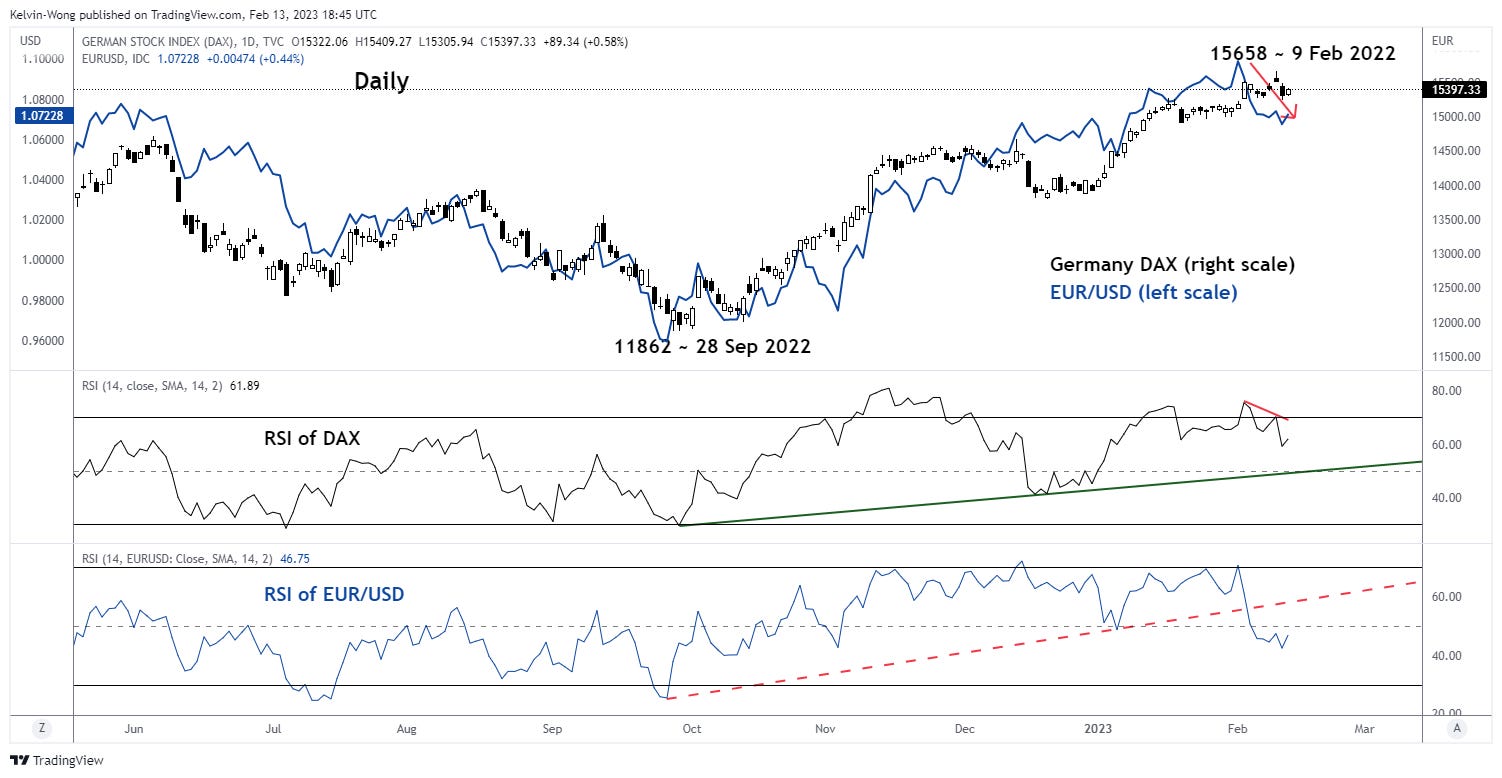
Source: TradingView as of 13 Feb 2023
The 32% multi-month rally of the Germany DAX Index in place since the 28 Sep 2022 low of 11,862 has moved in direct lock-steps with the EUR/USD.
The EUR/USD has exhibited downside momentum in the past 2 weeks via the bearish breakdown of a key ascending trendline support on its daily RSI oscillator on 3 February 2022 and it has continued to trend downwards below the 50% level and has not reached an oversold condition yet.
Thus, the EUR/USD seems to be playing a leading role in terms of momentum analysis and the DAX may see an imminent downside catch-up.
Global Macro Charts Of The Week – curated based on integrated technical analysis (fractals, momentum & graphical)
New additions…
CHF/JPY – Recent push-up seems overstretched ahead of new BOJ governor nomination
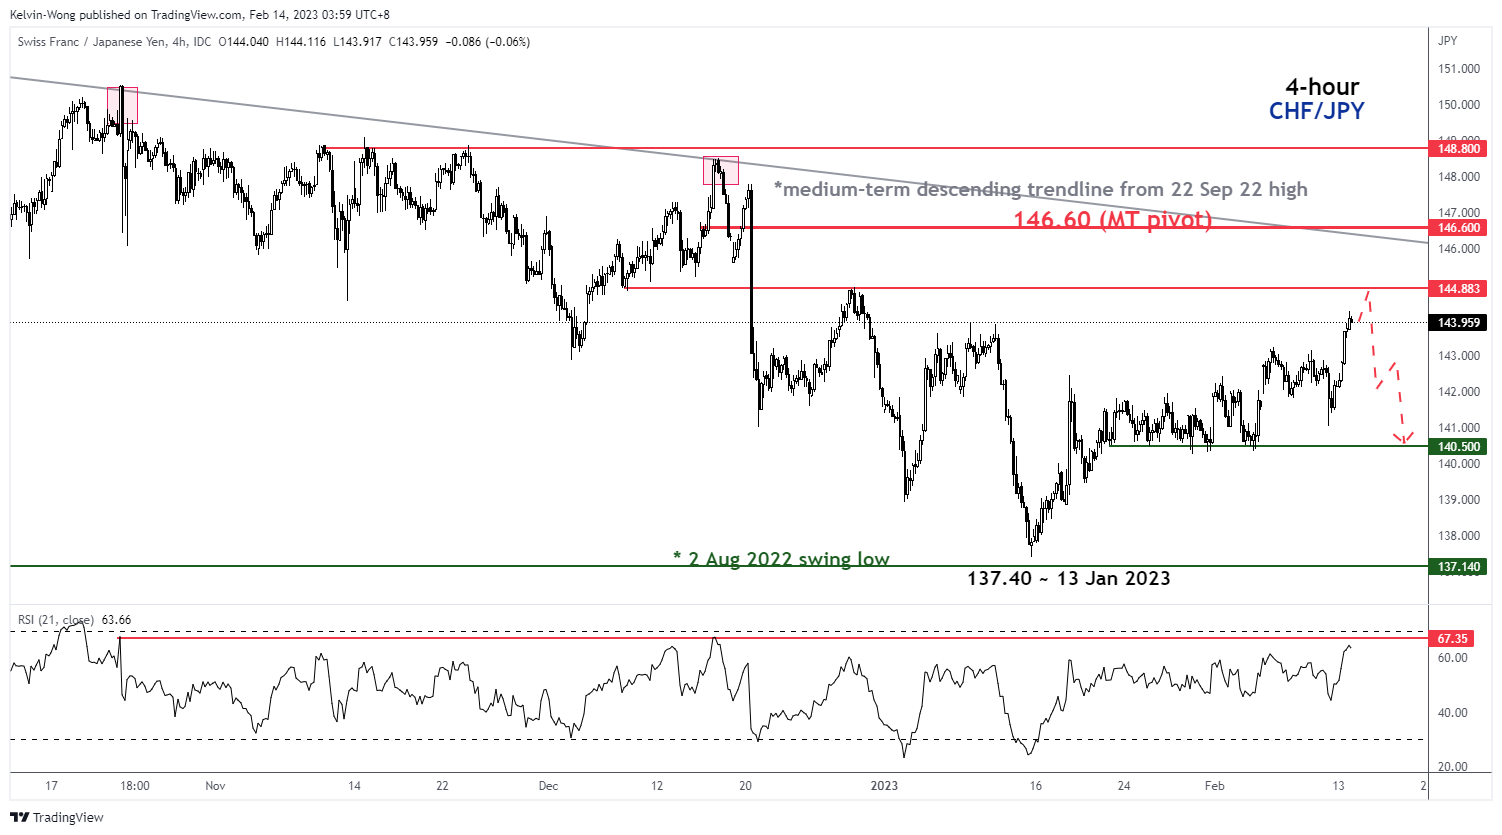
Source: TradingView as of 13 Feb 2023
The minor rally of +320 pips from last Friday, 10 February low of 141.04 has led the 4-hour RSI oscillator to hover just below a key resistance at the 67% level where it has led to prior bearish reversals thereafter as seen in the price actions of CHF/JPY on 21 October 2022 and 16 December 2022 that confluences with a retest a medium-term descending trendline from 22 September 2022 high.
Watch the 146.60 key medium-term pivotal resistance to provide a potential ceiling cap on the recent surge for a mean reversion decline to retest the 140.50 support in the first step. However, a break with a 4-hour close above 146.60 invalidates the bearish bias for a further squeeze up toward the next resistance at 148.80.
DAX (futures) – Medium-term uptrend looks exhausted
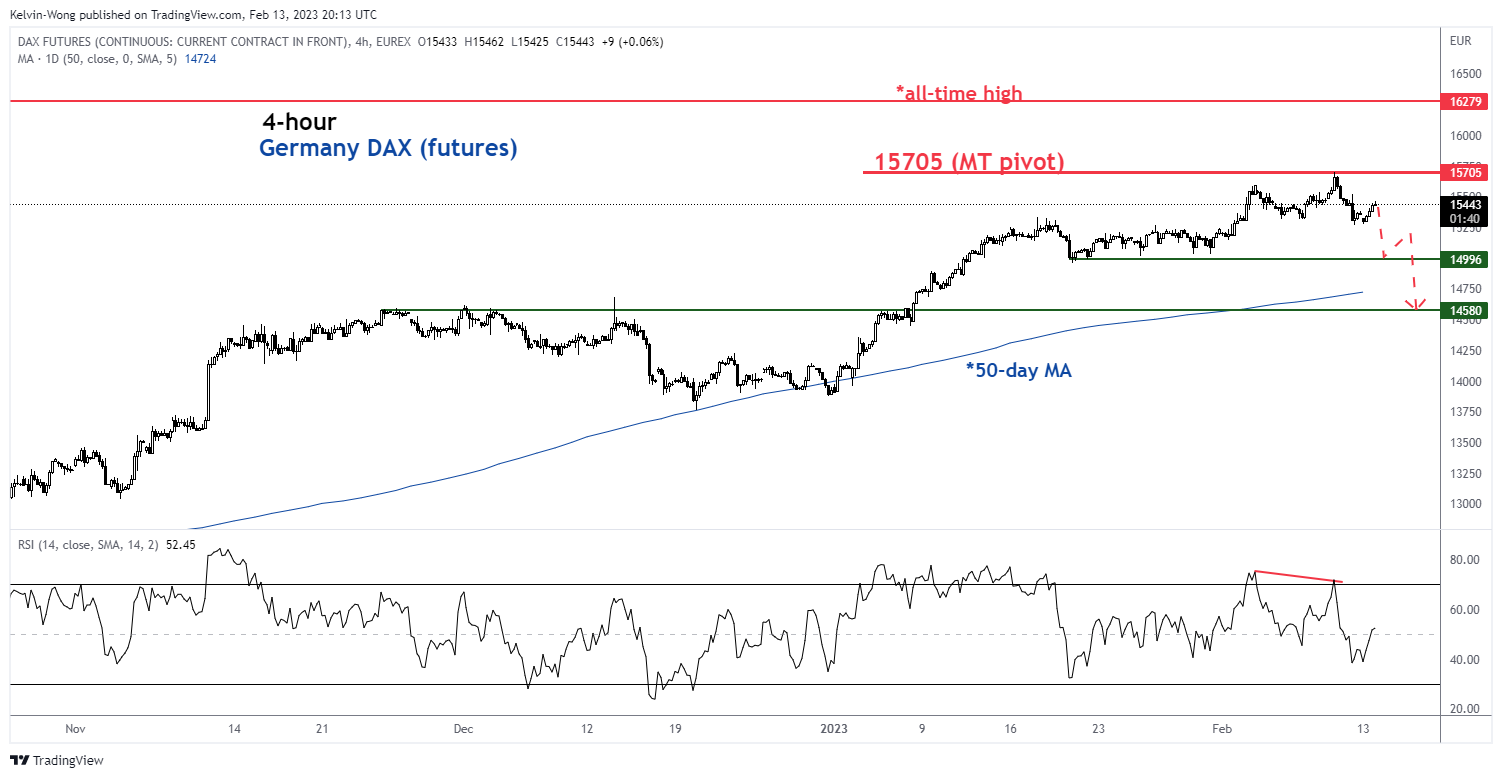
Source: TradingView as of 13 Feb 2023
Exhaustion signals have been flashed out which has increased the risk of at least a mean reversion decline for the DAX (futures).
Watch the 15,705 key medium-term pivotal resistance for a potential drop toward the supports of 14,996 and 14,580. On the other hand, a break with a 4-hour close above 15,705 invalidates the mean reversion decline scenario for a further push-up to retest the 16,279 all-time level, a third time if it occurs.
Short-term Tactical Global Macro Model Portfolio
Below is a summary table of assets from prior newsletters’ “Global Macro Charts Of The Week”
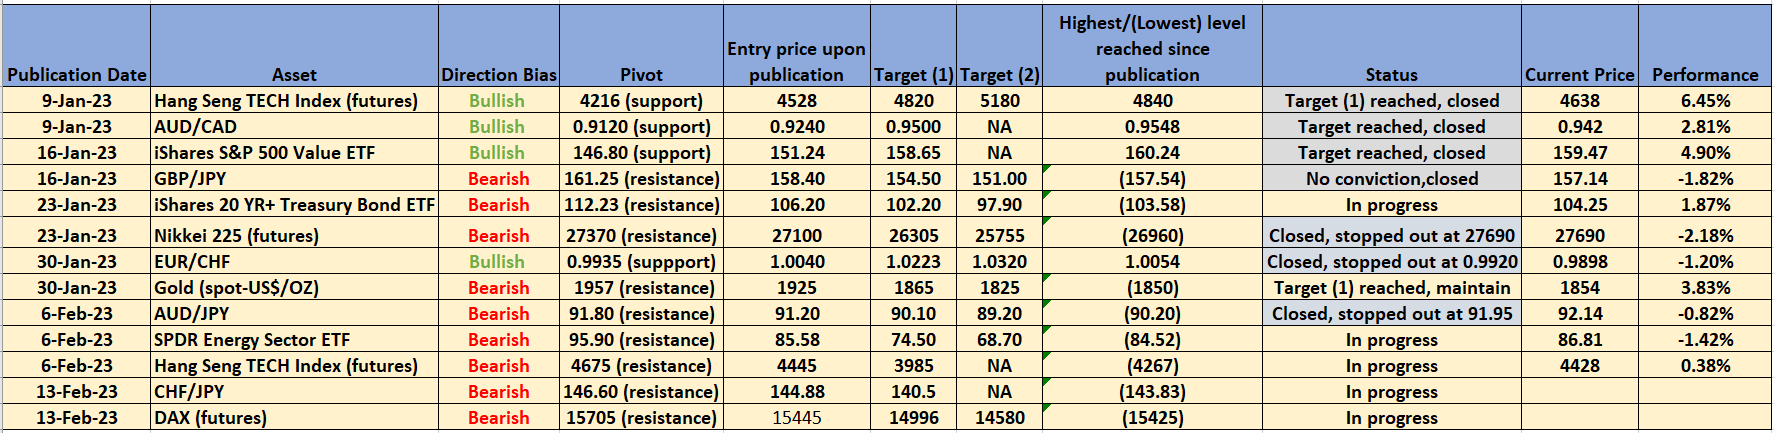
Source: TradingView as of 13 Feb 2023
Disclaimer
The content of this newsletter should not be construed as a solicitation to invest and/or trade. This is not trading/investment advice and all content is portrayed as opinion. Past performance is not indicative of future performance.
That’s all for today. I hope you enjoyed my analysis; do feel free to forward it to your friends, and colleagues. Remember to subscribe to the newsletter for the latest updates.