

Greetings folks! I am back after 5 weeks of hiatus from course study preparations. Welcome to the latest edition of the “Global Macro Weekly Playbook” newsletter where we will be taking a deep dive into the common narratives to uncover macro mispricing and how it impacts the broad-based asset classes from a tactical perspective.
Recap for last week…

Source: TradingView & MarketWatch

Source: TradingView
Key economic data & events to watch for this week
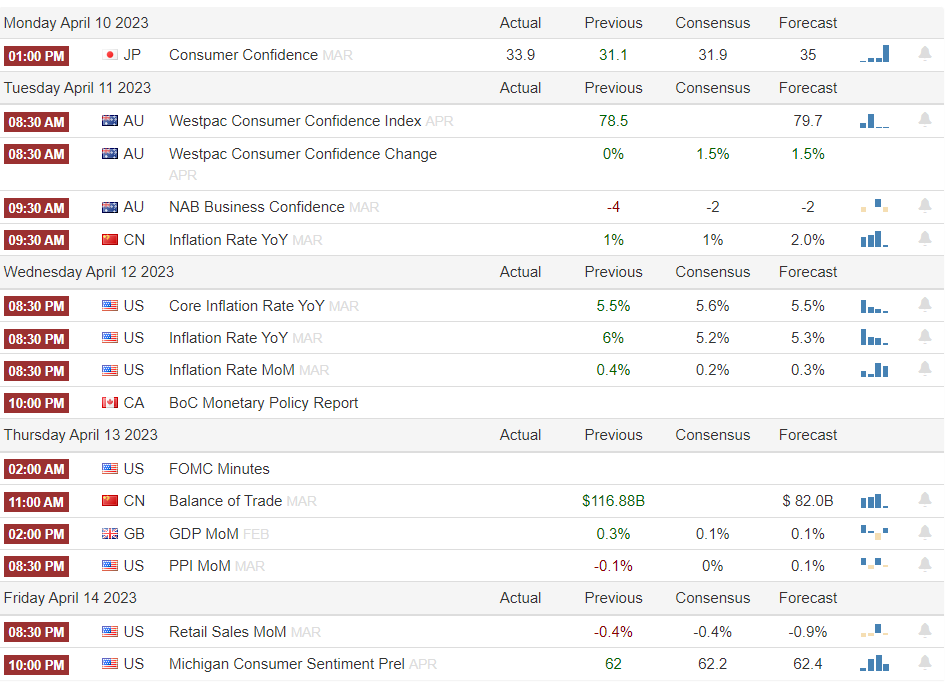
Source: Trading Economics (SG timing)
Other notable key economic data and events to watch:
IMF/World Bank Spring Meeting Monday to Saturday, 10 to 16 April
China New Loans/M2 Money Supply (Mar) on Tuesday, 11 April
Japan PPI (Mar) on Wednesday, 12 April
Singapore Q1 GDP Flash & MAS Monetary Policy Statement on Friday, 14 April
US Q1 2023 earnings season: The major banks; Citigroup, JP Morgan Chase, and Wells Fargo will kickstart the pivotal Q1 2023 reporting season on Friday, 14 April where the focus will be on the guidance of the risk of asset-liability duration mismatch after the recent turmoil in the US banking system triggered by the withdrawal of the massive deposits from the regional banks.

Going forward...
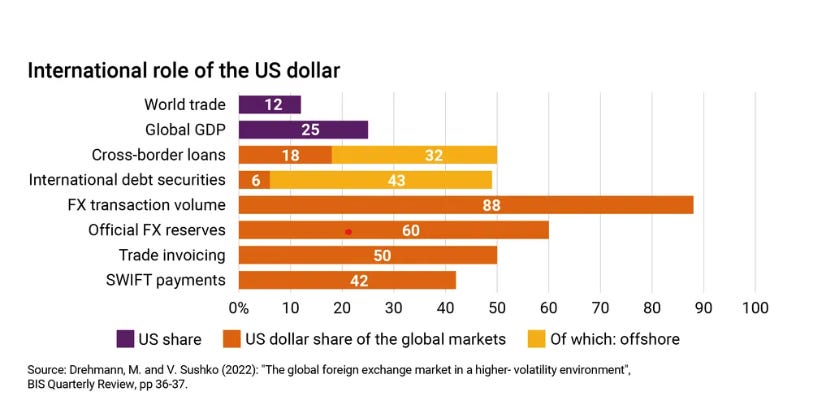
In the past two weeks, geopolitical tension has increased and reverberated across different facets such as the ongoing US-China technology trade war involving the supply of semiconductor chips and the developing countries’ growing disdain for the US dollar as a major reserve currency for international trade and debt settlement.
Russian State Duma Deputy Chairman Alexander Babakov has encouraged the world’s leading emerging economies; Brazil, Russia, India, China, and South Africa to create a common BRICS currency to counter the US dollar hegemony with China’s yuan playing a crucial role in such development.
Closer to Asia, the newly appointed Malaysian Prime Minister Anwar Ibrahim has expressed interest openly for a discussion with China on forming an Asian Monetary Fund to reduce reliance on the US dollar and the International Monetary Fund (IMF) after his recent official meet-up with China’s President Xi Jinping.
All these actions have upped the ante of deglobalization as developing countries sought to counter the adverse effects on their domestic economies caused by US monetary policy and reduce the risk of being held “hostage” by the US dollar-dominated SWIFT global settlement payment system
The dethroning of the King Dollar is unlikely to take place in the next one to three years as statistics from IMF as of the end of 2022 have indicated that the US dollar accounted for more than 58% of the global currency reserves versus a mere 2.7% share for the Chinese yuan as China’s capital account has yet to be fully open for international capital flows.

However, the movements in financial markets have a non-linear aspect driven by both rational and irrational behaviour of participants. In addition, bond traders have increased bets the Fed may be forced to deliver its first interest rate cut in 2023 due to recent turmoil in the banking system. Hence, a US dollar sell-off cannot be ruled out in the short to medium-term time horizon.
US Dollar Index is now looking vulnerable to breaking below its recent February 2023 low

Source: TradingView as of 7 Apr 2023
The US Treasury yield premium over ROW is now being compressed significantly which may put further downside pressure on the US dollar.
The spread of the UST 2-year yield over a similar duration of equal weight yield of Germany, UK, Japan, Canada, Switzerland, Australia, and Canada has fallen by 41 bps from 21 Mar 23 to the current level of 1.47%, a 7-month low
Integrated technical analysis (momentum & Elliot Wave/fractals) is advocating a potential breakdown of the 100.95 support of the US Dollar Index from a medium-term time horizon (1 to 3 months) as long as the 106.50 medium-term pivotal resistance is not surpassed by the upside.
A floor for oil prices
The “first shocker” to kickstart Q2 2023 came from the commodities space; in the global oil market, OPEC+ made a surprise unscheduled announcement on Sunday, 2 April to cut more than 1 million barrels of oil production daily. This latest production cut decision has created a U-turn from previous assurances that the cartel would hold the oil supply steady; the latest voluntary cuts will start in May and last until the end of 2023.

Source: Bloomberg

Source: TradingView as of 7 Apr 2023
The latest price actions of WTI crude oil futures have indicated a potential floor (support) at US$61.85/barrel after the latest OPEC+ production cut. On the topside, the bulls need to break a key medium-term hurdle at the US$83.35/barrel resistance which also confluence with the 200-day moving average that price actions have traded below it since 30 August 2022.
A break with a daily close above US$83.35/barrel may see a further push up toward the next resistance zone of US$93.50-97.40/barrel.
Global food prices are creeping up slowly as well
At the start of April two major agriculture trading houses; Cargill and Viterra announced their exit from the Russian wheat market due to the political complications from the aftermath of Russia’s ongoing invasion of Ukraine’s territories.
These latest developments where both Cargill and Viterra would halt grain purchases for export from the country have allowed Russia to tighten its grip on the global food supply chain as Russia is the world’s largest wheat exporter. Hence, it is likely to impact the prices of most agricultural products which in turn causes food inflation to be sticky on the upside as the global wheat supply is likely to be reduced and weaponized by Russia to be used as a bargaining chip to extract favorable outcomes for Russian in the current conflict with Ukraine and NATO.
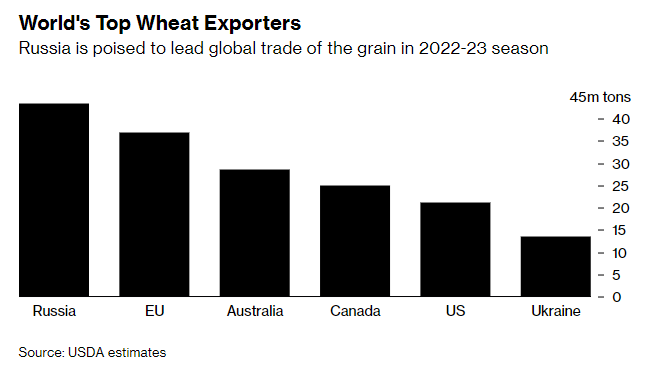
Source: Bloomberg
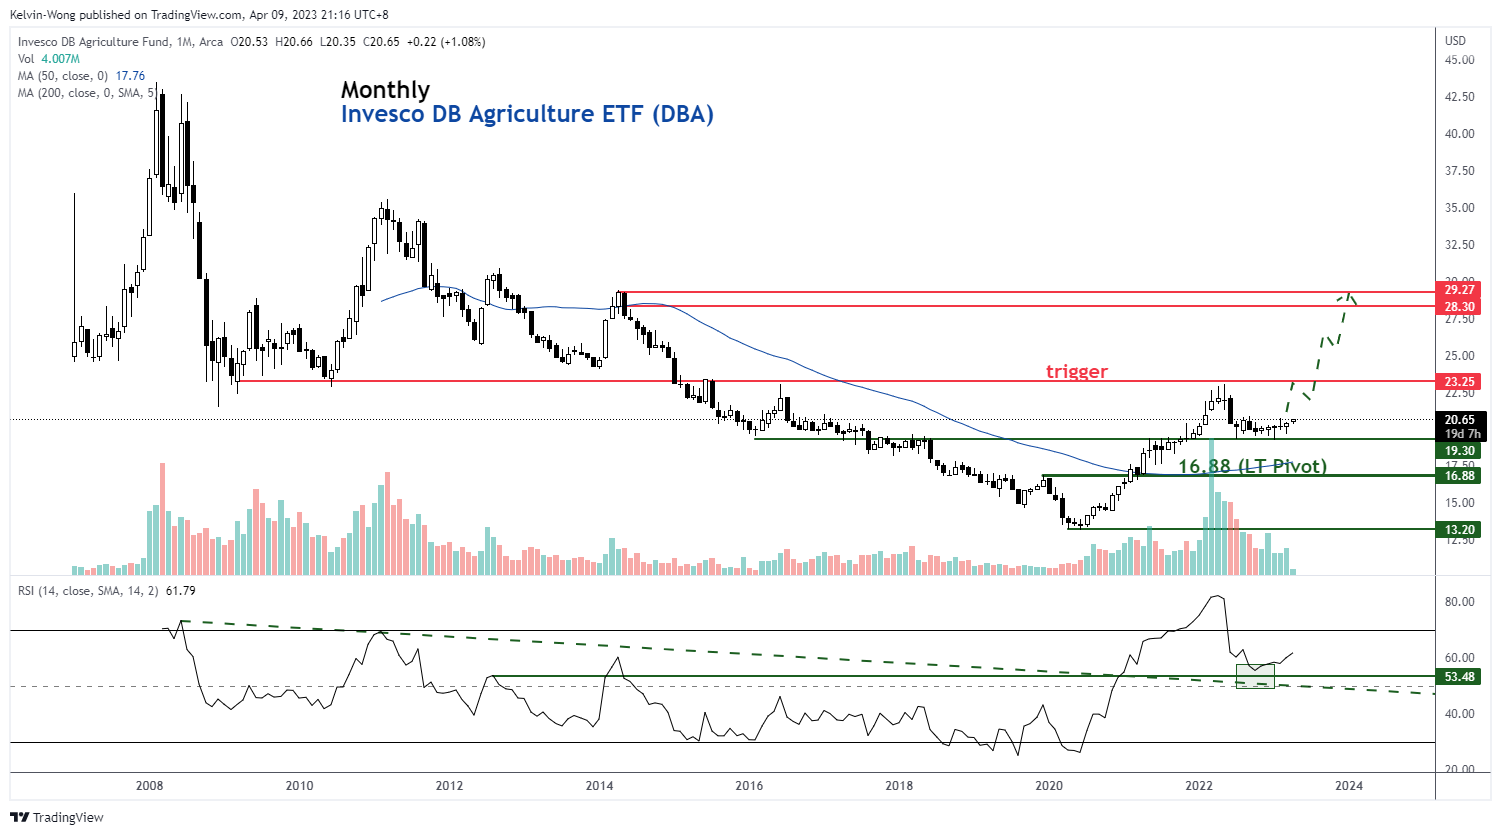
Source: TradingView as of 6 Apr 2023
Long-term integrated technical analysis of the Invesco DB Agriculture ETF (DBA) has started to flash out bullish elements; the formation of a series of bullish reversal candlesticks since January 2023 and upside momentum has started to resurface.
If the 16.88 long-term pivotal support holds and a clear break above 23.25 (trigger) is likely to see a continuation of the long-term secular bullish trend in place since April 2020 for a further potential push up towards the next major resistance zone of 28.30/29.30.
Overall, these observations suggest that the global inflation pressure is likely to stay elevated influenced by supply-side factors and further tightening of monetary policy may not impact much as higher interest rates can only reduce aggregate demand but have minimal impact on supply-side constraints. Hence, the US Federal Reserve and other central banks are going to face a tough balancing act to counter inflationary pressures going forward while avoiding a hard landing on the global economy.
Stagflation risk has resurfaced again

Source: TradingView as of 6 Apr 2023
The latest March data of the ISM Manufacturing PMI has decreased to 46.3 from 47.7 in February, the lowest reading since May 2020 and below a consensus of 47.5.
Likewise, the growth of non-manufacturing businesses in the US also has started to slow down but at a slower pace than its manufacturing peers. The ISM Services PMI fell to 51.2 in March from 55.1 in February and came in well below forecasts of 54.5; this latest reading pointed to the slowest growth in the services sector in three months.
Given that both the ISM Manufacturing and Services PMIs are leading economic indicators, the recession risk in the US has increased significantly based on their latest respective readings which in turn translates to an increased odd of global recession
Thus, the evil twins of recession and elevated inflation (stagflation) are backed in the driver’s seat.
Divergence in implied volatility of the bond market and stock market
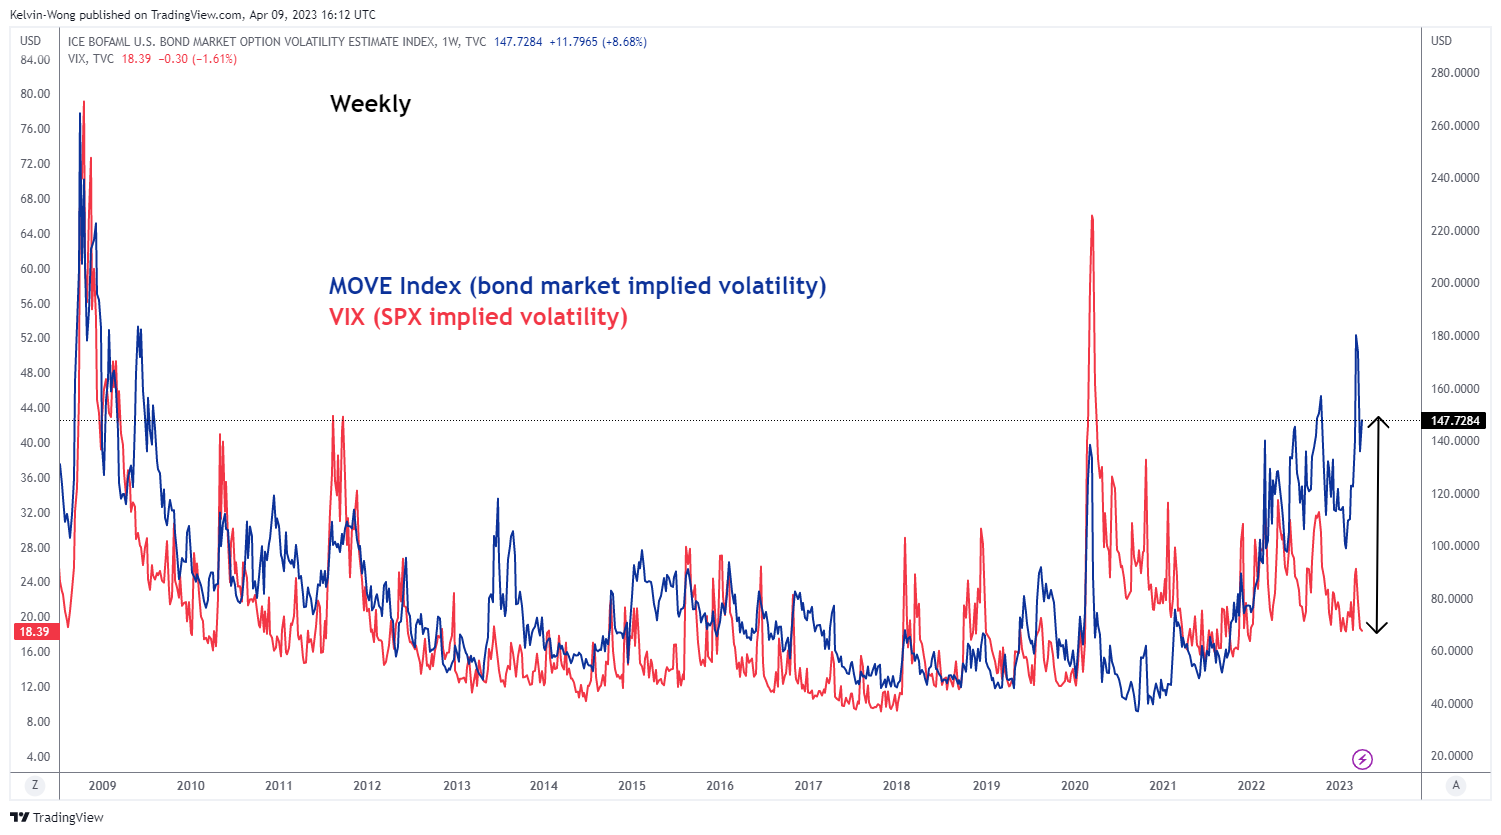
Source: TradingView as of 6 Apr 2023
Even though, turmoil in the US and European banking sectors have subsided in the recent week but the implied volatility of the fixed-income market via the ICE BOFAML US bond market option volatility estimate index (MOVE) staged a rebound last week, and its current level remains elevated as the same level seen during the onset of the Lehman Brother induced Great Financial Crisis in September 2008.
In contrast, the implied volatility of the US stock market has dipped down with the VIX back at its current year-to-date low of 18.
Based on historical price actions behaviour, the MOVE and VIX will move in tandem; thus, the current divergence is likely not to persist. It’s either the bond market options participants are too fearful and over-priced tail-risk or stock market options participants are being too complacent and under-priced tail-risk, especially the recent + 20% runup of the Nasdaq 100 in Q1 led by optimism about AI-related narrative.
Global Macro Charts Of The Week – curated based on integrated technical analysis (fractals, momentum & graphical)
New additions…
AUD/JPY – Short to medium-term weakness may persist

Source: TradingView as of 11 Apr 2023
The AUD/JPY cross pair has staged a recent bearish breakdown below a key support area which was the former major ascending trendline from the March 2020 pandemic low, retested, and reversed down from it on 4 April 2023.
Right now, its price actions have evolved into a medium-term ascending channel in place since its 13 September 2022 high of 98.69. If the 90.30 key medium-term pivotal resistance is not surpassed to the upside, AUD/JPY may see another round of potential impulsive down leg to retest the 87.00 psychological level (also the recent swing low area of 24 March 2023) a break below it adds impetus for a further slide towards the next support at 84.30
However, a clearance with a 4-hour close above 90.30 negates the bearish tone for a squeeze up towards the 93.10 range resistance in place since 14 December 2022 which also confluences closely with the key 200-day moving average.
iShares Semiconductor ETF (SOXX) – At the risk of a short to medium-term bearish reversal
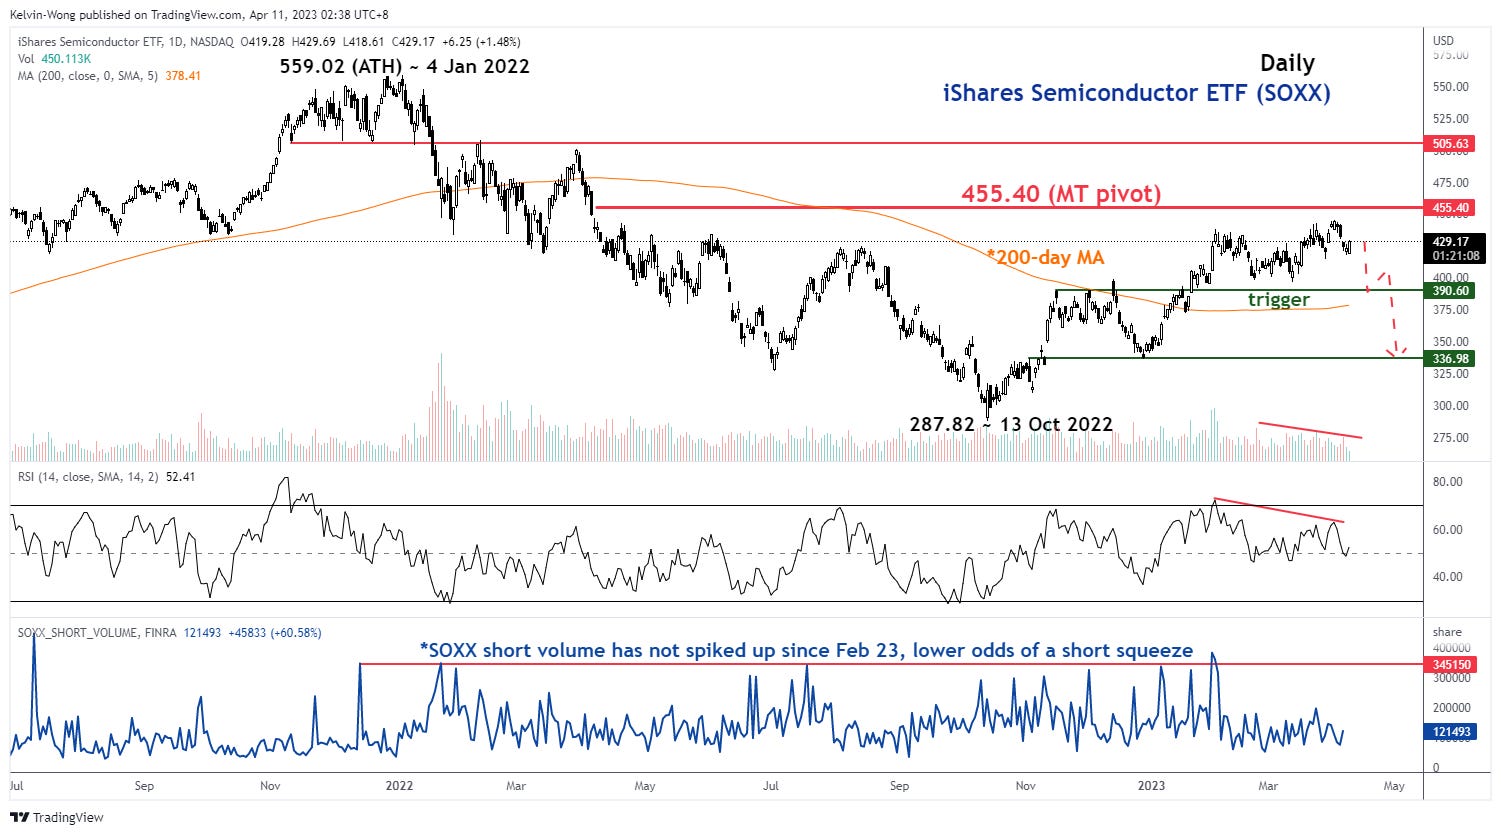
Source: TradingView as of 11 Apr 2023
The 54% rally seen in US semiconductor stocks as represented by the iShares Semiconductor ETF (SOXX) from its 13 October 2022 low of 287.82 has almost reached a key medium-term pivotal resistance of 455.40.
Several technical elements are now advocating potential bullish exhaustion; the recent up move from 21 Feb 2023 to 31 March 2023 has been accompanied by declining volume levels, upside momentum, has eased off as indicated by the bearish divergence signal flashed out by the daily RSI, and not much “enthusiasm” from short-sellers as the SOXX short volume has not spiked up since mid- February 2023 which reduces the risk of a short squeeze.
If the 455.50 key medium-term pivotal resistance is not surpassed, SOXX may see a drop toward the 390.60 support (close to the 200-day moving average) and a clear break with a daily close below it is likely to trigger a further decline towards the next support at 337.00.
On the other hand, a clearance with a daily close above 455.40 negates the bearish tone for a further push-up toward the next resistance at 505.60.
Short-term Tactical Global Macro Model Portfolio
Below is a summary table of assets from prior newsletters’ “Global Macro Charts Of The Week”

Source: TradingView as of 11 Apr 2023
Disclaimer
The content of this newsletter should not be construed as a solicitation to invest and/or trade. This is not trading/investment advice and all content is portrayed as opinion. Past performance is not indicative of future performance.
That’s all for today. I hope you enjoyed my analyses; do feel free to forward them to your friends, and colleagues. Remember to subscribe to the newsletter for the latest updates.